Meteorological Climatology of the North Sea and Surrounding Regions KLIWAS


Topics
- Access
- Description
- Parameters
- Coverage, spatial and temporal resolution
- Data quality
- Contact person
- References
- Data citation
Access
UNRESTRICTED:
- Get KNSC Atmo data via HTTP - all files at once with this wget script
- Access KNSC Atmo data via OPeNDAP
RESTRICTED:This link to the data set is only available for a restricted user group. The data set is only accessible in CEN/MPI net or accessible from external nets with a customer account. Please contact ICDC if you would like to access this data from outside the network.
- View KNSC Atmo data at LAS
- Data access via file system: /data/icdc/atmosphere/knsc/
Description
This data set was produced in a cooperation between the BSH, DWD and ICDC as part of the KLIWAS project.
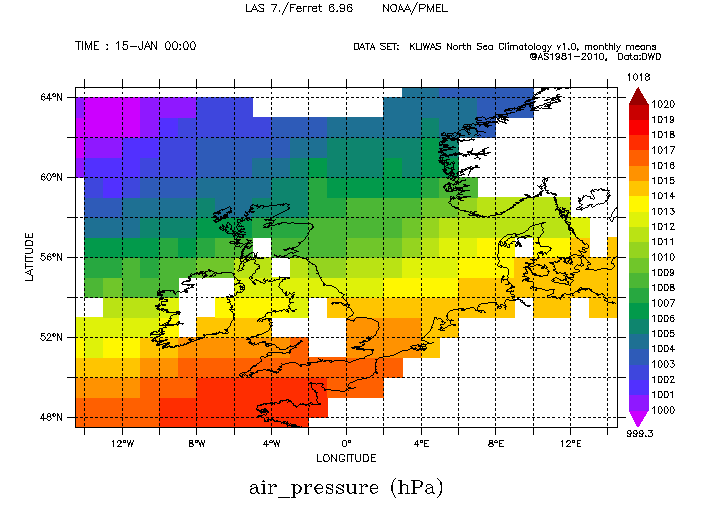
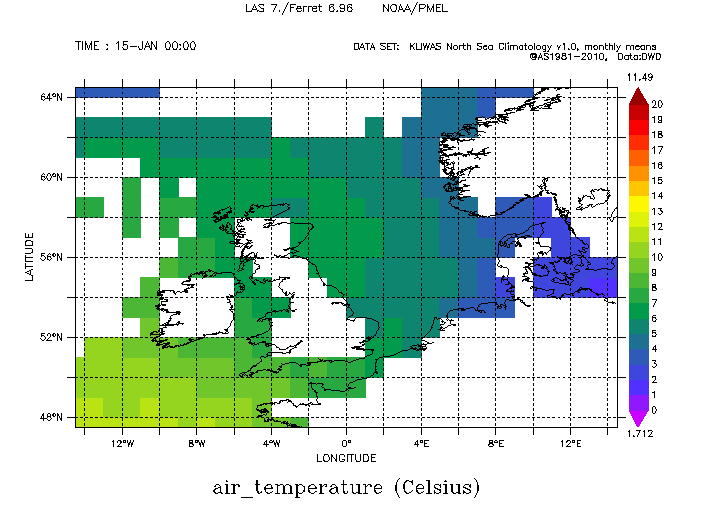
This is the first version (1.0) of a meteorological climatology for the North Sea in the region of 47 to 65 °N, 15 °W to 15 °E. It contains monthly and annual mean air temperature, air pressure and dew point data on a 1° x 1° latitude-longitude grid in the period 1950 to 2010. A detailed description of the data processing can be found in the documentation "Processing of meteorological data" (see references).
For the calculation of the means all available data from ship observations and buoys measurements in this period provided quality controled by the DWD (Deutscher Wetterdienst) were taken. For every month climatologies have been calculated for the standard periods 1951-1980, 1961-1990, 1971-2000 and 1981-2010. In order to construct the 30-year climatologies a minimum of 25 valid monthly means (out of 30), had to be available in a box, otherwise the box would not show up in the climatology.
Two methods has been used (in combination) to calculate the monthly means to account for the small numbers of data in many boxes and their uneven spatial and temporal distribution:
- If there was a notable annual cycle in the data, a polynomial (2nd order) was fitted to the data to eliminate the intramonthly variation for the monthly mean. Some residuals of intramonthly variations may have remained and thus contributed to the uncertainty of individual means. If no annual cycle was present, there had to be at least one measurement in 4 of all 6-day-periods per month and box. In addition the diurnal cycle was used for the air temperature to eliminate the diurnal variation.
- The neighbouring boxes were used in two steps (at first 8, if not enough the next 16) for calculating the mean value, if the count of data measurements was below a certain threshold (for air temperature and dew point 20 per box and month, for air pressure 500). That means that the resolution of some parameters (depending on the location) is worse than 1°x1° - especially for the air pressure, where almost for every box the 24 (=8+16) neighbouring boxes were taken. The center box has not been weighted.
The number of measurements and the number of boxes that were used to calculate the mean value has been provided in the data product as well.
The calculated monthly and annual means were assigned to the centers of the boxes:
- latitude: 47.5, 48.5, ..., 63.5, 64.5
- longitude: -14.5, -13.5, ..., 13.5, 14.5
Together with this data set, a hydrographic part was created: information on the hydrographic part of the KLIWAS North Sea Climatology.
This Climatology was temporally and spatially extended in the frame of the project Baltic and North Seas Climatology BNSC.
Last update of data set at ICDC: 2017
Parameters
| Name | Unit |
|---|---|
| airtemp (air temperature) | °C |
| airtemp_stddev (standard deviation) | °C |
| airtemp_noobs (number of observations) | - |
| airtemp_boxcount (number of boxes) | - |
| airpressure (air pressure) | hPa |
| airpressure_stddev (standard deviation) | hPa |
| airpressure_noobs (number of observations) | - |
| airpressure_boxcount (number of boxes) | - |
| dewpoint (dew point) | °C |
| dewpoint_stddev (standard deviation) | °C |
| dewpoint_noobs (number of observations) | - |
| dewpoint_boxcount (number of boxes) | - |
Coverage, spatial and temporal resolution
Period and temporal resolution:
- 1950 until 2010
- monthly, annual
Coverage and spatial resolution:
- Geographic Latitude: 47°N to 65°N
- Geographic Longitude: 15°W to 15°E
Format:
- NetCDF
Data quality
Please refer to the description to get information about the data quality.
Contact
Remon Sadikni
ICDC / CEN / University of Hamburg
E-Mail: remon.sadikni"AT"uni-hamburg.de(remon.sadikni"AT"uni-hamburg.de)Manfred Bersch
CliSAP / CEN / University of Hamburg
Email: manfred.bersch (at) uni-hamburg.de
References
-
Sadikni, R., N. H. Schade, A. Jahnke-Bornemann, I. Hinrichs, L. Gates, B. Tinz, and D. Stammer, 2018: The KLIWAS North Sea climatology. Part I: Processing of the atmospheric data. J. Atmos. Oceanic Technol., https://doi.org/10.1175/JTECH-D-17-0044.1 , 111–126.
-
Schade, N. H., R. Sadikni, A. Jahnke-Bornemann, I. Hinrichs, L. Gates, B. Tinz, and D. Stammer, 2017: The KLIWAS North Sea climatology. Part II: Assessment against global reanalyses. J. Atmos. Oceanic Technol., https://doi.org/10.1175/JTECH-D-17-0045.1 , 127–145.
-
Sadikni, Remon; Bersch, Manfred; Jahnke-Bornemann, Annika; Hinrichs, Iris; (2013): KLIWAS North Sea Climatology of Meteorological Data (Version 1.0); World Data Center for Climate (WDCC). doi:10.1594/WDCC/KNSC_met_v1.0
-
Documentation: "Processing of meteorological data" (pdf, not barrier-free)
-
Michaelsen, K (1998): Climate of the North Sea, Verlag: Deutscher Wetterdienst, ISBN : 978-3-88148-370-4
to top
Data citation
Please cite the data as follows:
Remon Sadikni, Manfred Bersch, Annika Jahnke-Bornemann, Iris Hinrichs (2013): Meteorological Climatology of the North Sea and Surrounding Regions, Centre for Earth System Research and Sustainability (CEN), University of Hamburg.
and the following acknowledgments:
Thanks to ICDC, CEN, University of Hamburg for data support.
