Meteorological climatology of Baltic and North Seas BNSC


Topics
- Access
- Description
- Parameters
- Coverage, spatial and temporal resolution
- Data quality
- Contact person
- References
- Data citation
Access
UNRESTRICTED:
- Access BNSC Atmo data via HTTP - all files at once with this wget script
- Access BNSC Atmo data via OPeNDAP
RESTRICTED:This link to the data set is only available for a restricted user group. The data set is only accessible in CEN/MPI net or accessible from external nets with a customer account. Please contact ICDC if you would like to access this data from outside the network.
- Data access via file system: /data/icdc/atmosphere/bnsc/
Description
This is the Baltic and North Seas Climatology (BNSC) that was produced in a cooperation between the BSH, DWD and ICDC. It is the follow-up project to the KNSC climatology.
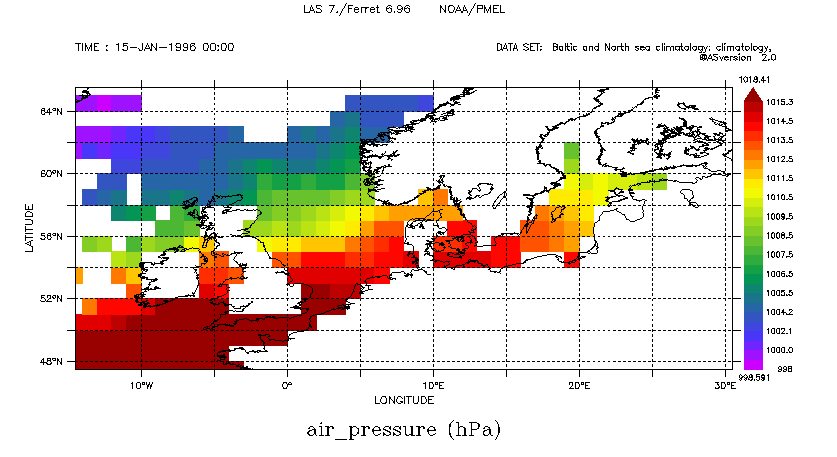
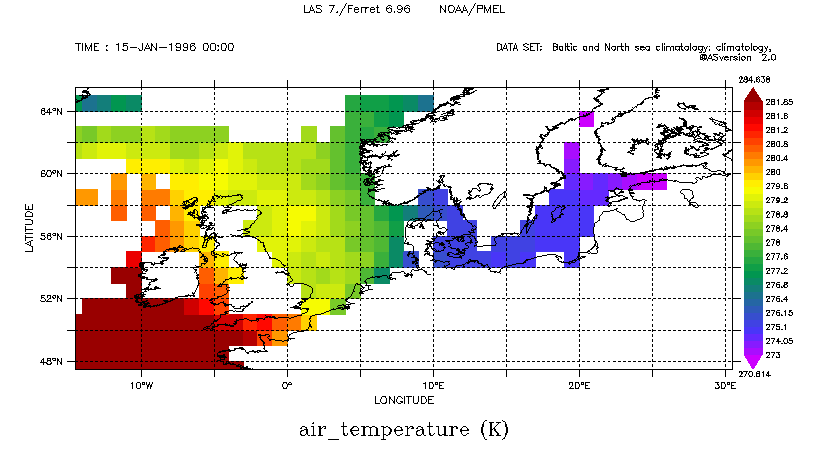
The BNSC has data for the Baltic Sea and the North Sea in the range 47 ° N to 66 ° N and 15 ° W to 30 ° E. The climatology was first made available to the public in March 2018 by ICDC and is published here in a slightly revised version 2. It contains the monthly averages of mean air pressure at sea level, and air temperature, and dew point temperature at 2 meter height. It is available on a 1 ° x 1 ° grid for the period from 1950 to 2015.
For the calculation of the mean values, all available quality-controlled data of the DWD (German Meteorological Service) of ship observations and buoy measurements were taken into account during this period. Additional dew point values were calculated from relative humidity and air temperature if available. Climatologies were calculated for the WMO standard periods 1951-1980, 1961-1990, 1971-2000 and 1981-2010 (monthly mean values). As a prerequisite for the calculation of the 30-year-climatology, at least 25 out of 30 (five-sixths) valid monthly means had to be present in the respective grid box. For the long-term climatology from 1950 to 2015, at least four-fifths valid monthly means had to be available.
Two methods were used (in combination) to calculate the monthly averages, to account for the small number of measurements per grid box and their uneven spatial and temporal distribution: 1. For parameters with a detectable annual cycle in the data (air temperature, dew point temperature), a 2nd order polynomial was fitted to the data to reduce the variation within a month and reduce the uncertainty of the calculated averages. In addition, for the mean value of air temperature, the daily temperature cycle was removed from the data. In the case of air pressure, which has no annual cycle, in version 2 per month and grid box no data gaps longer than 14 days were allowed for the calculation of a monthly mean and standard deviation. This method differs from KNSC and BNSC version 1, where mean and standard deviation were calculated from 6-day windows means. 2. If the number of observations fell below a certain threshold, which was 20 observations per grid box and month for the air temperature as well as for the dew point temperature, and 500 per box and month for the air pressure, data from the adjacent boxes was used for the calculation. The neighbouring boxes were used in two steps (the nearest 8 boxes, and if the number was still below the threshold, the next sourrounding 16 boxes) to calculate the mean value of the center box. Thus, the spatial resolution of the parameters is reduced at certain points and, instead of 1 ° x 1 °, if neighboring values are taken into account, data from an area of 5 ° x 5 ° can also be considered, which are then averaged into a grid box value. This was especially used for air pressure, where the 24 values of the neighboring boxes were included in the averaging for most grid boxes. The mean value, the number of measurements, the standard deviation and the number of grid boxes used to calculate the mean values are available as parameters in the products.
The calculated monthly and annual means were allocated to the centers of the grid boxes:
- Latitudes: 47.5, 48.5, ...
- Longitudes: -14.5, -13.5, …
In order to remove any existing values over land, a land-sea mask was used, which is also provided in 1 ° x 1 ° resolution.
In this version 2 of the BNSC, a slightly different database was used, than for the KNSC, which resulted in small changes (less than 1 K) in the means and standard deviations of the 2-meter air temperature and dew point temperature. The changes in mean sea level pressure values and the associated standard deviations are in the range of a few hPa, compared to the KNSC. The parameter names and units have been adjusted to meet the CF 1.6 standard.
Together with this data set, a hydrographic part was created: information on the hydrographic part of BNSC Climatology.
Last update of data set at ICDC: March 2018
Parameters
| Name | Unit |
|---|---|
| airtemp (air temperature) | °C |
| airtemp_stddev (standard deviation) | °C |
| airtemp_noobs (number of observations) | - |
| airtemp_boxcount (number of boxes) | - |
| airpressure (air pressure) | hPa |
| airpressure_stddev (standard deviation) | hPa |
| airpressure_noobs (number of observations) | - |
| airpressure_boxcount (number of boxes) | - |
| dewpoint (dew point) | °C |
| dewpoint_stddev (standard deviation) | °C |
| dewpoint_noobs (number of observations) | - |
| dewpoint_boxcount (number of boxes) | - |
Coverage, spatial and temporal resolution
Period and temporal resolution:
- 1950 until 2015
- monthly
Coverage and spatial resolution:
- Geographic Latitude: 47°N to 66°N
- Geographic Longitude: 15°W to 30°E
Format:
- NetCDF
Data quality
Please refer to the description to get information about the data quality.
Contact
Annika Jahnke-Bornemann
ICDC / CEN / University of Hamburg
E-Mail: annika.jahnke-bornemann"AT"uni-hamburg.de
References
-
Jahnke-Bornemann, Annika; Sadikni, Remon (2018). Baltic and North Seas Climatology meteorological part (Version 2.0). World Data Center for Climate (WDCC) at DKRZ. https://doi.org/10.1594/WDCC/BNSClim_meteo_v2
-
Sadikni, R., N. H. Schade, A. Jahnke-Bornemann, I. Hinrichs, L. Gates, B. Tinz, and D. Stammer, 2018: The KLIWAS North Sea climatology. Part I: Processing of the atmospheric data. J. Atmos. Oceanic Technol., https://doi.org/10.1175/JTECH-D-17-0044.1 , 111–126.
-
Hinrichs, Iris & Jahnke-Bornemann, Annika & Andersson, Axel & Ganske, Anette & Gouretski, Viktor & Jensen, Corinna & Klein, Birgit & Möller, Jens & Sadikni, Remon & Tinz, Birger. (2019). The Baltic and North Seas Climatology (BNSC)—A Comprehensive, Observation-Based Data Product of Atmospheric and Hydrographic Parameters. Frontiers in Earth Science. 7. 10.3389/feart.2019.00158.
Data citation
Please cite the data as follows:
Jahnke-Bornemann, Annika; Sadikni, Remon (2018). Baltic and North Seas Climatology meteorological part (Version 2.0). World Data Center for Climate (WDCC) at DKRZ. https://doi.org/10.1594/WDCC/BNSClim_meteo_v2
and with the following acknowledgments:
Thanks to ICDC, CEN, University of Hamburg for data support.
