Land
Parameters for the land surface
- Albedo
- Solar Irradiance
- Air temperature
- Precipitation
- Wind
- Land surface temperature
- Land use/ Vegetation
- Soil moisture and type
- Snow cover
- Topography and Geoid
- Permafrost distribution
- Countrycodes
- Land / Water distribution
Albedo
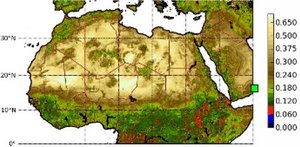
The surface albedo determines the amount of reflected solar radiation at the earth surface, its vegetation and clouds. The albedo is thus a key parameter for the shortwave radiation budget of the earth surface and the Earth as a whole. The surface albedo depends on land cover and radiative properties of the soil, snow and vegetation. Different types of surface albedo data products exist which allow to take into account the dependency of surface albedo on the illumination conditions (clear sky, diffuse conditions). The albedo is derived from spectral observations of the reflected sunlight in the visible frequency range by sensors like the MeteoSAT Satellites, the Medium Resolution Imaging Spectrometer (MERIS) and the Moderate Resolution Imaging Spectroradiometer (MODIS). Values of the albedo are typically given without units. Since it is the ratio between reflected and incident solar radiation it takes values between 0 and 1. An albedo of 1 means that all incident solar radiation is reflected. Clouds, snow and ice have a high albedo, land surfaces and vegetation have a comparably low albedo (see figure 2).
Data sources / products of the surface albedo are:
- Land surface albedo from MODIS (global, 2000-2025)
- EUMETSAT CM-SAF surface albedo - CLARA-A3 (global, AVHRR, 1979-2023)
- Land surface albedo from SPOT (global, 1999-2020)
Surface Solar Irradiance
The surface solar irradiance is a key parameter for the shortwave radiation budget of the earth surface and the Earth as a whole. The surface solar irradiance depends on the path length of the solar radiation through the atmosphere, on aerosol concentration, on cloud cover and on the surface albedo (see above). The surface solar irradiance is derived from spectral observations of the reflected sunlight in the visible frequency range by sensors like the Meteosat Satellites, the Medium Resolution Imaging Spectrometer (MERIS), the Moderate Resolution Imaging Spectroradiometer (MODIS), and CERES. Unit is Watts / m².
Data products for short-wave solar radiation on the ground:
- EUMETSAT CM-SAF Surface Solar Irradiance - SARAH-3 (Meteosat MVIRI & SEVIRI, 1983-2023)
- EUMETSAT CM-SAF surface short- and long-wave radiation - CLARA-A3 (global, AVHRR, 1979-2023)
- CERES surface radiation (EBAF) products (2000-2025)
- SRB surface radiation products (1983-2007)
Land surface temperature
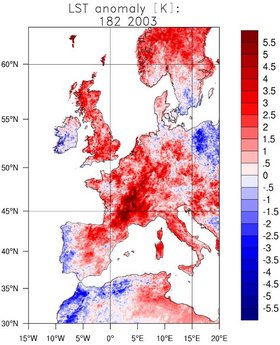
The land surface temperature is a key parameter for the quantification of the sensible heat flux and the long-wave radiation budget of the earth surface. Clear-sky (cloud free) conditions are required to determine the land surface temperature from satellite data. The satellite sensor measures the thermal (infrared) emission of the surface. The energy received by the sensor is translated into an infrared surface temperature which in turn is converted into the surface temperature with the aid of the infrared surface emissivity. This procedure, however, requires depending on the satellite sensor a number of corrections like for atmospheric scattering. Satellite sensors used are the Advanced Very High Resolution Radiometer (AVHRR), MeteoSAT, the Moderate Resolution Imaging Spectroradiometer (MODIS) and the (Advanced) Along Track Scanning Radiometer ((A)ATSR). Land surface temperatures are given in degree Celsius (°C) or Kelvin (K).
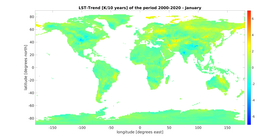
The shown Figures 3 and 4 display applications of land surface temperatures (LST) that have been derived from MODIS data; Top: Anomalies of the LST for the month of Juli of the record summer 2003; bottom: Trend of the LST for January 2000-2018.
Vegetation / Land use
Land use and vegetation play an important role for a number of applications and processes, e.g. the determination of sensible and latent heat fluxes, evaporation and soil moisture, retrieval of snow cover and depth, and quantification of the short- and long-wave radiation budget over bare, vegetated and other parts of the land surface, e.g. urban areas. In order to derive land use categories and vegetation coverage from space again data from a number of different satellite sensors can be used, operating in the visible (see Albedo) and/or the infrared (see Land surface temperature) part of the electromagnetic spectrum (AVHRR, MODIS, MeteoSAT, MERIS, MIPAS, SPOT). In order to end up with geophysical products of interest (see below) often data from several frequencies have to be combined and a number of corrections has to be carried out (for atmospheric attenuation, cloud cover, solar angle, satellite viewing angle, et cet.)
These three parameters are amongst those most widely used:
a) fraction of absorbed photosynthetically active radiation (FAPAR)
b) leaf area index (LAI)
- Combined AVHRR - MODIS LAI (http://cliveg.bu.edu/modismisr/lai3g-fpar3g.html)
- LAI from MODIS (2000-2024)
- LAI from SPOT / PROBA-V / Sentinel-3 OLCI (1998-2025)
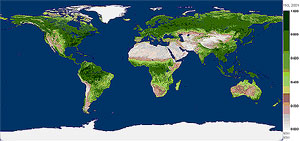
c) Normalized Differenced Vegetation Index (NDVI) (see Figure 5)
- MODIS NDVI and EVI (2000-2025)
- AVHRR GIMMS NDVI (1981-2015)
In addition one can (partly based on the above-mentioned parameters) derive the land cover type (i.e. needleleaf forest, broadleaf forest, savanna, et cet.) according to, e.g., definitions of the International Geosphere Biosphere Programme (IGBP), or percentage fractions of vegetation and/or forest:
- Fraction of green vegetation cover (SPOT, PROBA-V, Sentinel-3 OLCI) (1998-2025)
- MODIS Land Cover Type (2001-2024)
- MODIS Forest Cover Fraction (2000-2024)
- MODIS Primary Production (2000-2024)
Soil moisture, type, and evaporation
The moisture content of the soil is a key variable which has a strong influence on the partitioning of the available energy at the land surface. In case of sufficient water supply the evapotranspiration rate of the land surface is higher, while it is lower in case of low moisture content. As a consequence, soil moisture affects the energy exchange between the land surface and the atmosphere, which also affects the development of the atmospheric boundary layer.
Closely linked to the soil moisture is the soil type. The type of the upper soil layer influences substantially the soil moisture, run-off, and storage capacity.
Different satellite based methods have been developed to retrieve soil moisture information of the upper few centimeters of the soil from satellite data using active or passive microwave remote sensing methods. Satellite sensors used for this are the Advanced SCATterometer (ASCAT) aboard METOP and the Advanced Microwave Scanning Radiometer (AMSR-E) aboard the EOS-Satellites TERRA and AQUA. In 2009 the European Space Agency has launched a dedicated soil moisture satellite mission: Soil Moisture and Ocean Salinity (SMOS).
- SMOS soil moisture (CATDS RE04 + OPER) (2010-2025)
- Re-processed soil moisture from ESA-CCI ECV project v09.1 (1978-2023)
- ASCAT soil moisture (2007-2024)
- AMSR-E soil moisture (2002-2011)
- GLEAM - Evaporation components & root zone soil moisture (1980-2024)
Here you can find information about soil type:
- Harmonized World Soil Database (HWSD)
- Digital Soil Map of the World (currently deprecated)
- Interactive visualisation of global soil-type distribution
Topography and Geoid
The topography of the Earth (on land and below the water line, i.e. the bathymetry) surface influences air flow and ocean currents, land hydrology (e.g. run-off) and glacier flow. In order to understand and correctly interpret climate-relevant processes, and in order to predict the impact potential future climate change may have, a global topography data set is important.
Here, we offer the topography data set: ETOPO1, with a spatial resolution of 1' (one arc minute = 1 nautical mile = 1.852 km); this is the successor of similar data sets with coarser spatial resolution: ETOPO2v2 and ETOPO5. The offered ETOPO1 data set is grid registered and over land shows the ice sheet surface (not the bedrock) (see NOAA-NGDC).
The ETOPO1 data set is a composite comprising a number of different data sources; information about these and the methods used to combine these is given in the ETOPO1 Development Report (pdf, not barrier free).
Access: (Attention: File size is 250 Mb - 400 Mb!) via
/data/icdc_main/DATA/land/topography/DATA/
in the formats: geotiff, netCDF-GMT4, and netCDF-GDAL. The latter alternative is offered because of problems with GDAL reading the other, GMT4-based version (see readme-file).
ETOPO1 data have to be cited like this:
Amante C., and B. W. Eakins, 2009, ETOPO1 1 arc-minute global relief model: procedures, data sources and analysis, NOAA Technical Memorandum NESDIS NGDC 24, 19 pp., National Geophysical Data Center, Marine Geology and Geophysics Division, Boulder, Colorado.
More information is given under NOAA-NGDC.
For those of you who work with the Antarctic and require information about its topography, the location of observation stations, rock outcrops, etc., we recommend the latest issue of the Antarctic Digital Data Base (Version 6.0) hosted by BAS and SCAR.
Thanks to the work of the IBCAO a new bathymetric chart of the Arctic Ocean has been released recently. This Version 3.0 now comes with a grid resolution of 500 m x 500 m. More details you can find in Jakobsson et al. (2012).
For the investigations of the Earth gravity field, the derivation of MDT or SSH and the derivation of sea ice and ice sheet thickness the geoid of the Earth needs to known. We offer two recent geoid models, one global and one which is limited to t he Arctic Ocean:
- EIGEN-6C2
- ArcGP
Permafrost distribution
Occurrence and distribution of permafrost or frozen soil plays a fundamental role for the hydrological cycle and biochemical fluxes (like of CO2 or Methane) between soil and atmosphere. Spatial-temporal changes of permafrost distribution and layer thickness can be seen as indicator of climate change. Its amplification in Arctic and sub-Arctic regions seems to have initiated a reduction in permafrost distribution and vertical extent in some areas already.
We link here to a unique data set of permafrost distribution, vertical extent and other related parameters that has been compiled at the ETH-Zurich:
On the above-mentioned web site you can find versions of this data set as kml-file for Google Earth, in ArcGIS format and as raw binary file (3 GB!). The spatial resolution of this data set is 30 arcseconds (that is less than 1 km). It covers the area 60°S to 90°N and comprises 43200 x 18000 grid cells.
We recommend the following reference for reading (in advance) and for citing the data when used in presentations / articles / etc .:
Countrycodes
Couple of users are interested in information about countries in a gridded format, e.g. to calculate a country mean temperature.
For those users we offer a netCDF file with gridded country information with the area each country occupies coded with a specific number on a 0.5° x 0.5° grid. The assignment of these codes to the respective country is given in the associated table.
Land-Water-Distribution
For users who need to know the land-water-distribution at fine spatial resolution we offer here the MOD44W data set. It is based on data of the SRTM shuttle mission and MODIS and provides the land-water-distribution at 250 m spatial resolution and annual temporal resolution (2000-2022). See here for more details about Land-Water-Distribution.

