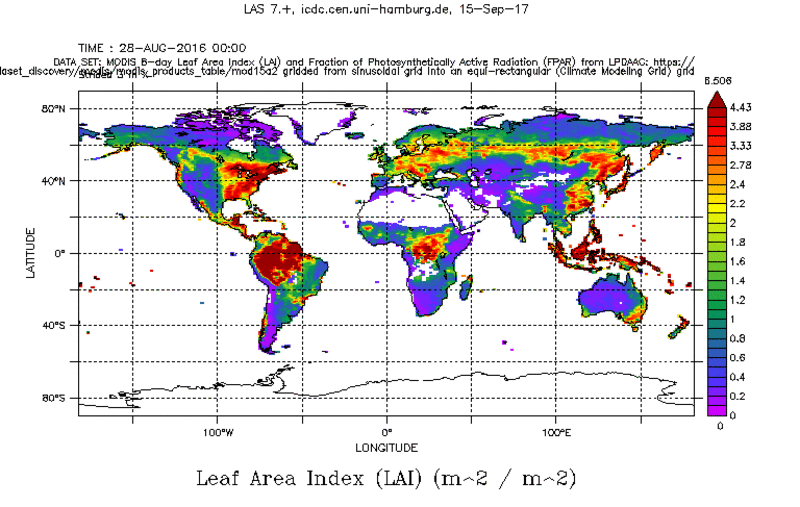
Leaf Area Index LAI and FAPAR from MODIS

Topics
- Access
- Description
- Parameters
- Coverage, spatial and temporal resolution
- Data quality
- Contact person
- References
- Data citation
Access
UNRESTRICTED:
- Get single LAI data via THREDDS
Download all data: wget script global files | wget script Tiles as zip files - Access LAI data via OPeNDAP
- Via ZFDM:
RESTRICTED: This link to the data set is only available for a restricted user group. The data set is only accessible in CEN/MPI net or accessible from external nets with a customer account. Please contact ICDC if you would like to access this data from outside the network.
- Access data via ICDC's MODIS Tiles Download Tool: On the website choose a tile on the map and get the corresponding data paths and THREDDS download links
- Data access via file system: /data/icdc/land/modis_lai_fpar
Description
Atmospheric influence corrected surface reflectances of up to 7 spectral bands of reflectance measurements of the MODIS sensors aboard both EOS platforms: TERRA and AQUA, are used to derive the Leaf Area Index (LAI) and the fraction of the absorbed (by green vegetation) photosynthetically active, i.e. 400-700 nm, radiation (FAPAR). For high enough solar elevation angels a radiative transfer modeling (RTM) approach is used. For small solar elevation angles and/or if the main algorithm based on the RTM fails due to other reasons an empirical back-up algorithm is used which - like the RTM based one - includes MODIS and other land cover products and the respective distribution of vegetation types (biomes) but which is less physical in the setup.
The key features of the RTM based approach as well as of the empirical algorithm are described in the Algorithm Theoretical Basis Document (ATBD, see references). This approach has been developed further since the first MODIS LAI data set release, which was collection 3); the current version belongs to the Collection 6.1 suite of MODIS data products. An extensive literature list about the different retrieval stages can be found at th website of the Climate and Vegetation Research Group, see references.
One of the key improvements towards collections 5 and 6 (see LAI/FPAR change report in references) was the inclusion of more biomes; different vegetation causes different canopy reflectance and a more detailed and more reliable classification into different biomes was found to increase success for LAI and FPAR retrieval.
We have the entire data set MOD15A2H of Collection 6.1 available - organized into tiles with 500 m grid cell resolution and also gridded onto a global 0.5 degree x 0.5 degree resolution climate modeling grid (CMG).
Last update of data set at ICDC: February 13, 2025.
Parameters
| Name | Unit | Comments /Valid values |
|---|---|---|
| Fraction of photosynthetically active (400-700nm) i.e. absorbed by green vegetation radiation (FAPAR) | % | 0 ... 1 |
| Leaf area index = Lead area per unit ground area (LAI) | m² / m | 0 ... 10 |
| FAPAR retrieval standard deviation | - | |
| LAI retrieval standard deviation | m² / m² | |
| Detailed quality flag | - |
0, 1, 5, 6, 9; added to 0, 10, 20, 50, 100, 110, 120, and 150, respectively |
| Quality flag for land | - | 0, 10, 20, 40, 60, 100, 120, 140, 200, 220, 240 |
| Quality flag for cloud and aerosol | - |
0, 1, 10, 11, 20, 21, 30, 31, 100, 101, 110, 111, 120, 121, 200, 201 |
| Quality flag method | - |
|
| Name | Unit | Comments /Valid values |
|---|---|---|
| Mean fraction of photosynthetically active (400-700nm) i.e. absorbed by green vegetation radiation (FAPAR) | % | 0 ... 1 |
| Mean leaf area index = Leaf area per unit ground area (LAI) | m² / m² | 0 ... 10 |
| Variance of mean FAPAR | % | 0 ... 1 |
| Variance of mean LAI | m4 / m4 | 0 ... 10 |
| Mean FAPAR retrieval standard deviation | - | |
| Mean LAI retrieval standard deviation | m² / m² | |
| Number of valid FAPAR or LAI values per grid cell | - | 0 ... 14196 |
| Number of valid retrieval standard deviation values per grid cell | - | 0 ... 14196 |
| Primary (most common) quality flag in grid cell | - | 0 ... 700 |
| Secondary (2nd most common) quality flag in grid cell | - | 0 ... 700 |
| Primary (most common) land surface type in grid cell | - | 0 ... 900 |
| Secondary (2nd most common) land surface type in grid cell | - | 0 ... 900 |
| Fraction of pixels with cloud cover | % | 0 ... 100 |
| Fraction of pixels with considerable aerosol load | % | 0 ... 100 |
Coverage, spatial and temporal resolution

Period and temporal resolution:
- 2000/02 - 2024/12
- 8-daily
Coverage and spatial resolution:
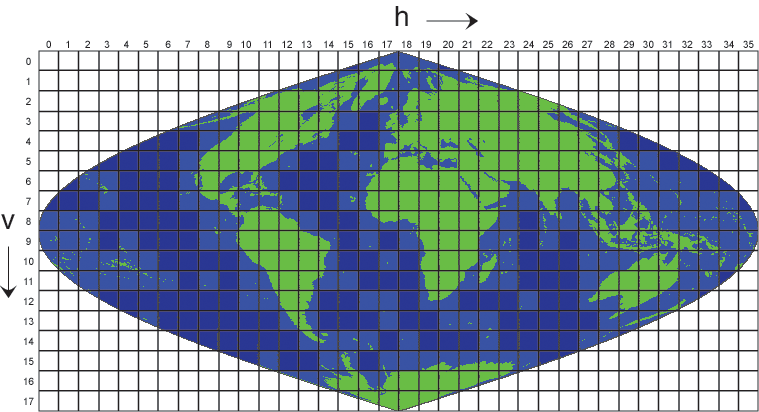
- Global or split into tiles of ~10° latitude and 10+° longitude (see image)
- Spatial resolution: Climate Modeling Grid (CMG): 0.5° x 0.5°; tiles: 500m x 500m, MODIS sinusoidal grid
- Geographic Latitude: CMG: -89.75 to 89.75; tiles: depends on tile
- Geographic Longitude: CMG: -179.75 to 179.75; tiles: depends on tile
- Dimension: CMG: 360 rows x 720 columns; tiles: 2400 rows x 2400 columns per tile
- Altitude: following terrain
Format:
- NetCDF
Data quality
The data set contains retrieval uncertainties for both parameters LAI and FAPAR. In addition the data set contains a number of quality flags.
The most simple one distinguishes between the methods used and allows us to discriminate between areas with very good retrievals, where the main method based on radiative transfer modeling was used and areas with "just" good retrievals, where the main method needed to be replaced by an empirical method because, e.g., a too low solar elevation. This latter issue is the reason why in some maps - depending on geographic latitude and season - LAI and FAPAR retrieval standard deviations are missing.
The other quality flags (3 layers) give information about the land cover other than the biomes used, e.g. whether snow has been detected or whether the area is mainly a built-up one, about the influence of clouds and aerosol (with or without aerosol or clouds, cirrus or no cirrus, cloud shadows, etc.) and for those who prefer really detailed information there is a detailed quality flag - where one can find for instance where a pixel was just assumed to be cloud free.
The references list selected literature dealing with MODIS LAI and FAPAR evaluation - mainly for the collection 5 MODIS LAI and FAPAR data. The paper by Disney et al., 2016 (see references) contains a good overview about differences in methodology between different approaches and points to the potential limitations of this data set.
We recommend to also take a look at the comments about data quality for the combined AVHRR-LAI data set.
Contact
Ranga Myneni
Climate and Vegetation Research Group
Department of Earth and Environment, Boston University, MA, U.S.A.
email: myneni (at) bu.eduStefan Kern
University of Hamburg
E-Mail: stefan.kern (at) uni-hamburg.de
References
Literature:
- ATBD, MODIS Leaf Area Index (LAI) And Fraction Of Photosynthetically Active Radiation Absorbed By Vegetation (FPAR) Product (MOD15), Algorithm Theoretical Basis Document, Version 4.0 (pdf, not barrier free)
- MODIS LAI/FPAR Change Report C005 (pdf, not barrier free)
- MODIS LAI/FPAR Product Users's Guide (pdf, not barrier free)
- Disney, M.; Muller, J.-P.; Kharbouche, S.; Kaminski, T.; Voßbeck, M.; Lewis, P.; Pinty, B. A New Global fAPAR and LAI Dataset Derived from Optimal Albedo Estimates: Comparison with MODIS Products. Remote Sens. 2016, 8, 275. https://doi.org/10.3390/rs8040275
- Fang, H., et al., 2012, Theoretical uncertainty analysis of global MODIS, CYCLOPES and GLOBCARBON LAI products using a triple collocation method, Remote Sens. Environ., 124, 610–621. https://doi.org/10.1016/j.rse.2012.06.013
- Fang, H., et al., 2013, Characterization and intercomparison of global moderate resolution leaf area index (LAI) products: Analysis of climatologies and theoretical uncertainties, J. Geophys. Res. - Biogeosciences, 118, 529-548, doi:10.1002/jgrg.20051. https://doi.org/10.1002/jgrg.20051
- Fang, H., et al., 2013, The impact of potential land cover misclassification on MODIS Leaf Area Index (LAI) estimation: A statistical perspective, Remote Sens., 5, 830-844, doi:10.3390/rs5020830. https://doi.org/10.3390/rs5020830
- R. Liu, "Compositing the Minimum NDVI for MODIS Data," in IEEE Transactions on Geoscience and Remote Sensing, vol. 55, no. 3, pp. 1396-1406, March 2017, doi: 10.1109/TGRS.2016.2623746. https://doi.org/10.1109/TGRS.2016.2623746
- Yang, W., et al., 2006, Analysis of leaf area index products from combination of MODIS Terra and Aqua data, Remote Sens. Environ., 104, 297-312. https://doi.org/10.1016/j.rse.2006.04.016
- Zhang, Y., et al., 2017, Reanalysis of global terrestrial vegetation trends from MODIS products: Browning or greening? Rem. Sens. Environ., 191, 145-155. https://doi.org/10.1016/j.rse.2016.12.018
- Jiang, C., et al., 2017, Inconsistencies of interannual variability and trends om long-term satellite leaf-area index products. Global Change Biology, 23, 4133-4146, doi: 10.1111/gcb.13787. https://doi.org/10.1111/gcb.13787
Websites:
- Planetary Greenness Research with MODIS, AVHRR and Other Sensors, Climate and Vegetation Research Group, Boston University, http://cliveg.bu.edu/modismisr/atbds/modisdocs.html
- DKRZ's Mistralpp, https://www.dkrz.de/up/services/analysis/data-processing/processing-on-mistral
Data citation and License
Please cite the data as follows:
Tiles:
MODIS LAI and FPAR data from Myneni, R., Knyazikhin, Y., Park, T. (2025). MOD15A2H MODIS/Terra Leaf Area Index/FAPAR 8-Day L4 Global 500m SIN Grid V061. NASA EOSDIS Land Processes DAAC. http://doi.org/10.5067/MODIS/MOD15A2H.061 [last access: January 13, 2025], distributed by the Land Processes Distributed Active Archive Center (LP DAAC), located at the U.S. Geological Survey (USGS) Earth Resources Observation and Science (EROS) Center (lpdaac.usgs.gov), provided with de-coded quality flags and per grid cell latitude / longitude information in netCDF format by the Integrated Climate Data Center (ICDC), CEN, University of Hamburg, Germany: https://doi.org/10.25592/uhhfdm.10866 [last access: MM-DD-YYYY].
Global:
Globally gridded MODIS Terra Collection 6.1 8-daily LAI and FAPAR at 0.5 degree grid resolution derived at ICDC, https://doi.org/10.25592/uhhfdm.8584 [last access: MM-DD-YYYY], from Myneni, R., Knyazikhin, Y., Park, T. (2025). MOD15A2H MODIS/Terra Leaf Area Index/FPAR 8-Day L4 Global 500m SIN Grid V061. NASA EOSDIS Land Processes DAAC. http://doi.org/10.5067/MODIS/MOD15A2H.061 [last access: January 13, 2025].
Licence: The data was published under the Creative Commons Attribution 4.0 International License (CC-BY-4.0).
