Cryosphere - Ice and Snow
Ice and snow parameters
 |
 |
 |
 |
On the ocean
- ESA CCI Sea Ice ECV project
- Sea ice cover
- Sea ice area
- Sea ice drift
- Sea ice thickness
- Sea ice type / Polynyas / Leads
- Melt ponds on sea ice
- Snow depth on sea ice
Over land
Some selected links
- Climate and Cryosphere (CliC)
- National Snow and Ice Data Centre (NSIDC)
- Meereisportal of the Alfred-Wegener Institute (AWI)
- Near-Real Time Eisinformation von Drift & Noise
- Polar Prediction Webpage
- Snow, Water, Ice and Permafrost in the Arctic (SWIPA) 2017
- Arctic Report Card
- IPY 2007-2009
- British Antarctic Survey (BAS)
- Multidisciplinary drifting Observatory for the Study of Arctic Climate (MOSAiC)
Sea ice cover
The sea ice concentration or sea ice area fraction is the main parameter describing the sea ice cover. It is usually given in % and is the percentage fraction of a known area (e.g. a grid cell) covered by sea ice.
Sea ice concentration data offered by ICDC:
- Eumetsat OSI SAF: using SMMR/SSM/I/SSMIS satellite observations (OSI-450a and OSI-430a)
- ESA CCI Sea Ice ECV project (version 2.0 and 2.1)
- Sea ice concentration error spatial correlation length scales for high-concentration pack ice, 2002-2011:
- University of Hamburg - ASI algorithm sea-ice concentrations from AMSR-E and from SSM/I-SSMIS.
- Visualisation of the ASI-algorithm sea-ice concentration time series on youtube by Niklas Röber, DKRZ
- AMSR2 ASI algorithm v110 sea-ice concentration - Arctic - 3.125km (ftp download of png from AWI, not barrier free)
- AMSR2 ASI algorithm v110 sea-ice concentration - Antarctic - 3.125km (ftp download of png from AWI, not barrier free)
AMSR2 ASI algorithm v110 sea-ice concentration README
- from ship-based observations (ASPeCt; ASSIST/IceWatch, Arctic & Antarctic)
- from historical & satellite-based observations from Walsh et al. for the Arctic for 1850-2013 (see also Walsh et al., Geograph. Rev., 107(1), 2017)
We note that ASI sea ice concentration data are merely based on data of the near 90 GHz channels of SSM/I, SSMIS, AMSR-E, and AMSR2. The finer spatial resolution achieved by doing so, occasionally comes at the expense of the accuracy of the product. One the one hand, spurious or unrealistically high sea ice concentrations could occur over the open water and in the marginal ice zone due to an uncorrected weather influence. On the other hand, over high ice concentration areas unrealistically low sea ice concentrations could occur. These could be caused by changes in the physical properties of the sea ice and the snow on top of the ice due to varying weather conditions.
Between March and April 2016 sea ice concentration processing was switched from DMSP-f17 to DMSP-f18. Preliminary investigations show that Arctic sea ice area might be 1-2% lower, Antarctic sea ice area about 1% higher for DMSP-f18 than for DMSP-f17.
The actual development of the sea ice cover can be seen in the monthly sea-ice concentration anomalies relative to 1992-2021 in the top right based on ASI algorithm SSM/I - SSMIS sea ice concentration data.
Animations of the anomalies for the period 2010-01 to 2025-08 are shown here for the Arctic and the Antarctic. Note that we display NEGATIVE sea ice anomalies in red because these correspond to POSITIVE temperature anomalies and vice versa for positive sea ice anomalies which are given in blue. The black (grey) line denotes the actual (climatological) position of the 15% ice concentration isoline for the respective month for the reference period 1992-2021.
Sea ice area
Common integral parameters describing the hemispheric or global sea ice cover are the total sea ice extent and the sea ice area (in km²). Sea ice extent is the sum of the area of all sea-ice covered grid cells; often a threshold of 15% is used to define a grid cell as being covered by sea ice. While the sea ice extent still serves as the backbone of many studies investigating long-term trends of the polar sea ice covers, this variable as the disadvantage to not take into account any sea ice concentration variations within the ice cover. Where the sea ice concentration is 100% or 50% does not matter, the sea ice extent remains the same.
In contrast, sea ice area is the sum of the area of all sea-ice covered grid cells weighed by the actual sea-ice concentration. Hence, the actual sea ice concentration influences the sea ice area and an, on average, less compact sea ice cover will result in a smaller sea ice area than a highly compact sea ice cover. It has been shown and argued in a few recent publications that sea ice area can be considered a more meaningful estimate of the state of the hemispheric sea ice cover.
For the computation of sea-ice extent and area the grid-cell area of the respective grid is required. For data on EASE2 grid (such as observations like the OSI-450a / OSI-430a product), the grid-cell area is the square of the grid size. For data on a polar-stereographic grid, e.g. the NSIDC grid, (such as the ASI SSM/I-SSMIS product) the grid-cell area varies with latitude. Files with the grid-cell areas for the NSIDC polar-stereographic grid can be found here at NSIDC or download here NetCDF files for the Arctic with 25 km grid.
Sea ice drift data:
Sea ice drift
Sea ice drift is the displacement of sea ice (either single floes in case of buoy observations, or of certain areas in case of satellite observation) within a certain time period. Typical units are km/day and cm/s, or start and end co-ordinate of a drift (or displacement) vector. Satellite remote sensing has led to time series similarly long (25-30 years) as for the sea ice cover.
Sea ice drift data:
Sea ice thickness
Currently, the sea ice thickness is amongst the sea-ice parameters that are still very difficult to obtain over large areas; yet no sea ice thickness data time series exist, based on observations, which cover large areas over an entire seasonal cycle. Available data are based on satellite altimetry (sea ice thickness estimated from sea ice freeboard height, i.e. that sea ice part that looks above the water line), satellite radiometry (sea ice thickness estimated from physical relationship between ice thickness, salinity, temperature and emissivity), air-borne systems (provide ice+snow thickness), underwater observations (sea ice thickness estimated from sea ice draft, i.e. that sea ice part below the water line), and in-situ observations (ice cores). Unit is in meters.
Sea ice thickness data:
- from Envisat & Cryosat-2 satellite altimetry (ESA-SICCI2, Arctic & Antarctic) and satellite laser altimetry (Antarctic, ICESat-1, ESA-CCI Sea Ice ECV project)
- from SMOS satellite observations (Arctic)
- from satellite laser altimetry (Arctic)
- from satellite RADAR altimetry (Arctic, CryoSat-2)
- from ship-based observations (ASPeCt; ASSIST/IceWatch, Arctic & Antarctic)
In addition:
- Antarctic sea-ice volume (experimental)
- Arctic Ocean sea-ice volume
Sea ice type / Polynyas / Leads


Sea ice can be divided in different types, i.e. according to its age (multiyear ice, first-year ice, young ice), degree of deformation (level ice, rafted/ridged ice), or location (marginal ice zone, pack ice, fast ice, lead, polynya). These types are given in different units, i.e. as absolute or percentage area fraction (e.g. multiyear ice), or as probability of occurrence (e.g. polynyas).
Sea ice type data:
- from ship-based observations (ASPeCt; ASSIST/IceWatch, Arctic & Antarctic)
Distribution of Polynyas and Leads
- Antarctic polynyas
- Arctic lead area fraction (AMSR-E)
- Arctic lead area fraction (CryoSat-2)
- Arctic lead distribution (MODIS)
- Area and ice production of the North Open Water (NOW) polynya
Sea ice age (can be considered as proxy for sea ice type and thickness):
Melt ponds on Arctic sea ice

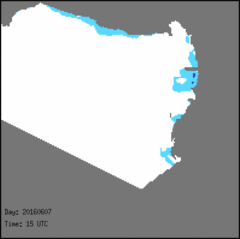
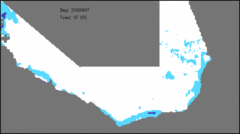
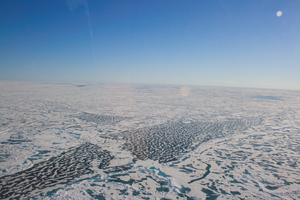
During the summer melt period Arctic sea ice is covered by so-called melt ponds (see photography in fig. 11 ). The fractional coverage of sea ice with melt ponds depends on initial snow depth, onset and duration of summer melt and ice type. Melt ponds appear dark compared to the surrounding sea ice. They absorb more solar radiation than the surrounding sea ice which accelerates sea ice melt (positive feedback). Sea ice underneath melt ponds is also thinner and allows more solar radiation to penetrate the sea ice and warm the water underneath. The earlier melt ponds develop in the season the more solar energy is available for sea ice melt.
Melt pond identification or mapping using satellite data is still a challenge because of
- the small size of melt ponds and
- the quite persistent cloud cover during summer in the Arctic ocean.
Using a combination of reflectances measured with different channels of the Moderate Resolution Spectroradiometers MODIS in a neural network allows to identify and map the fractional melt pond coverage on Arctic sea ice with weekly temporal resolution.
Snow depth on sea ice
Sea ice is typically covered by snow. A retrieval of its thickness is similarly complicated as the sea-ice thickness observation. Yet only few snow depth on sea ice data time series exist, based on observations, which cover larger areas and a full seasonal cycle. Snow depths are typically given in cm.
Snow depth on sea ice data:
- from satellite microwave radiometry (Antarctic AMSR-E, ESA-CCI Sea Ice ECV project)
- from ship-based observations (ASPeCt; ASSIST/IceWatch, Arctic & Antarctic)
Snow depth / water equivalent (SWE)
One important quantity in the global hydrological cycle is the amount of water that is accumulated as snow on land. So, in addition to its impact on the surface heat and radiation budget (see snow cover) snow plays an important role for soil moisture, river run-off, and by this for water availability during and after snow melt.
The most relevant parameter in this context is the so-called snow water equivalent (SWE). SWE is a measure for the amount of water that is contained in the snow pack on an area of 1 m²; in other words: SWE describes the amount of water released during snow melt. The unit of SWE is millimeter (mm). The advantage of using SWE instead of the snow depth is that it includes the effect snow density has. A low-density (soft snow at low temperatures, say -20°C) snow cover of 1 m thickness amounts to far less liquid water when melted than a high-density (damp to wet snow at high temperatures, say 0°C) snow cover. Especially for the model-based prediction of melt water run-off and river-runoff and thus for the prediction of potential flooding along the rivers SWE is a fundamental quantity
In-situ observations of snow depth and density, e.g. at routine observation stations of the World Meteorological Organization (WMO), have a high accuracy. However, such observations are not necessarily representative for a larger area, and the observational network is not very homogeneous.
Satellite observations are thus a real alternative. Based on space-borne observations of the surface brightness temperature at two different frequencies in the microwave frequency range (usually at 19 GHz and 37 GHz), e.g. using Special Sensor Microwave / Imager (SSM/I) data, SWE can be determined via an empirical relationship. This has been done for the datasets provided here.
- SWE from SMMR / SSM/I or AMSR-E [Data available from the National Snow and Ice Data Center (NSIDC); limited usefulness, see paper by Mortimer et al., 2020, https://doi.org/10.5194/tc-14-1579-2020 ]
- SWE from SSM/I / AMSR-E via ESA GlobSnow
Snow cover
Knowing the snow cover on land is essential for the correct estimation of the surface radiation budget. Snow reflects a larger part of the incident shortwave solar radiation back to space than most other natural surfaces like grass, trees, or water. At the same time snow according to its physical temperature emits as much long-wave (thermal) radiation as these other natural surfaces. Areas covered by snow exhibit a negative radiation balance therefore. Also, already a snow cover or a few centimeters thickness acts as a good isolator for the soil.
It is therefore essential to know where snow can be found, or, more precisely, what the snow-covered area fraction of a specific region is. This area fraction can be estimated, e.g., using radiance differences measured with space-borne spectroradiometers such as MODIS - this can happen with more or less sophisticated automated routines or by trained analysts manually.
- MODIS snow cover (2000 - 2025)
- Snow cover from ATSR / AATSR data (GlobSnow)
- Interactive Multisensor Snow and Ice Mapping System (IMS) snow cover (1998/2004 - 2025)
- The data portal at ENVEO: http://cryoportal.enveo.at provides near-realtime information about the daily snow cover in the pan-European area derived from optical and microwave satellite data.
Land ice cover
Land ice, to most known as glacier, is another important component of the Earth's climate system. Land ice exhibits a higher shortwave albedo than most land surfaces and/or vegetation, similarly to snow. Therefore, land ice also reflects quite a high portion of solar radiation. Consequently a land ice cover influences the local, regional and or even the global climate depending on its size. Additionally, land ice stores a large amount of fresh water; in some regions land ice (melt water) comprises the only reliable source of fresh water. Finally, retreat and advance of land ice area and/or volume is an indicator of air temperature changes or of changes in the hydrological cycle of that land ice cover (balance between accumulation and ablation), and thus land ice parameters can reflect climate variability and/or indicate climate change. A routine observation of land ice area, volume, and other parameters is therefore mandatory.
Land ice area
- World Glacier Inventory (updated 2012)
- Global Land Ice Measurement from Spase (GLIMS) Glacier Database
- World Glacier Monitoring Service
- Global Glacier Changes: Facts and Figures
Land ice movement & elevation
- Ice velocity of the Antarctic ice sheet
- ESA Greenland CCI: Elevation changes and ice velocities for Greenland: http://products.esa-icesheets-cci.org
- Elevation of the Greenland ice sheet (MEaSUREs Greenland Ice Mapping Project (GIMP) Digital Elevation Model from GeoEye and WorldView imagery): http://nsidc.org/data/nsidc-0715/
- Elevation of the Greenland ice sheet (MEaSUREs Greenland Ice Mapping Project (GIMP) Digital Elevation Model): http://nsidc.org/data/nsidc-0645/
- MEaSUREs Greenland 6 and 12 day Ice Sheet Velocity Mosaics from SAR, Version 2 (January 2015 to December 2024): http://nsidc.org/data/nsidc-0766/versions/2 and https://doi.org/10.5067/1AMEDB6VJ1NZ
- MEaSUREs Greenland Ice Sheet Mosaics from Sentinel-1A and 1B SAR data, Version 4 (based on data from January 2015 to April 2025): https://nsidc.org/data/nsidc-0723/versions/4 and https://n5eil01u.ecs.nsidc.org/MEASURES/NSIDC-0723.004/
- MEaSUREs Greenland Ice Velocity: Selected Glacier Site Velocity Maps from InSAR, version 4, vom NSIDC DAAC / NASA EOSDIS: https://nsidc.org/data/nsidc-0481
- Ice velocity of the outlet glaciers of Greenland from Landsat 1972-2015: https://data1.geo.tu-dresden.de/flow_velocity (see also: Rosenau, R.; Scheinert, M.; Dietrich, R. (2015). A processing system to monitor Greenland outlet glacier velocity variations at decadal and seasonal time scales utilizing the Landsat imagery. Remote Sensing of Environment, vol. 169, pp. 1-19, https://doi.org/10.1016/j.rse.2015.07.012)
- Ice velocities, ice shelf and glacier calving zones are offered at the data portal of ENVEO: http://cryoportal.enveo.at
Other
- MEaSUREs Antarctic Boundaries for IPY 2007-2009 from satellite RADAR data sets: http://nsidc.org/data/nsidc-0709/
- Grounding line of the Antarctic ice sheet


