Antarctic polynyas


Topics
- Access
- Description
- Parameters
- Coverage, spatial and temporal resolution
- Data quality
- Contact person
- References
- Data citation
Access
UNRESTRICTED:
RESTRICTED:This link to the data set is only available for a restricted user group. The data set is only accessible in CEN/MPI net or accessible from external nets with a customer account. Please contact ICDC if you would like to access this data from outside the network.
- Data access via file system: /data/icdc/ice_and_snow/ssmi_polynya
Description
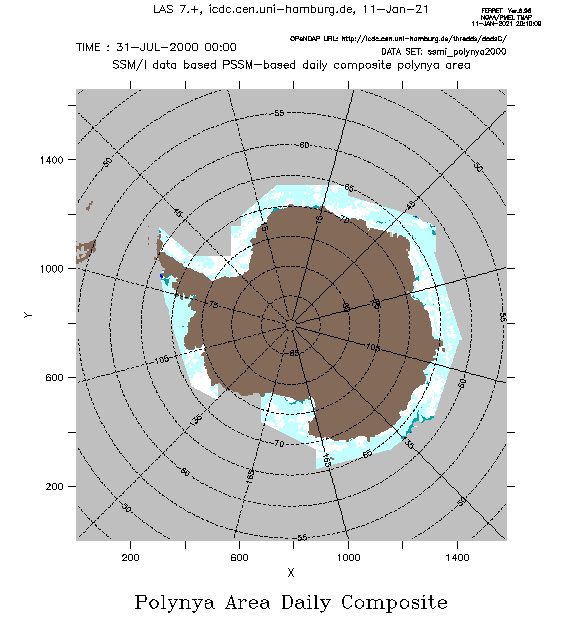
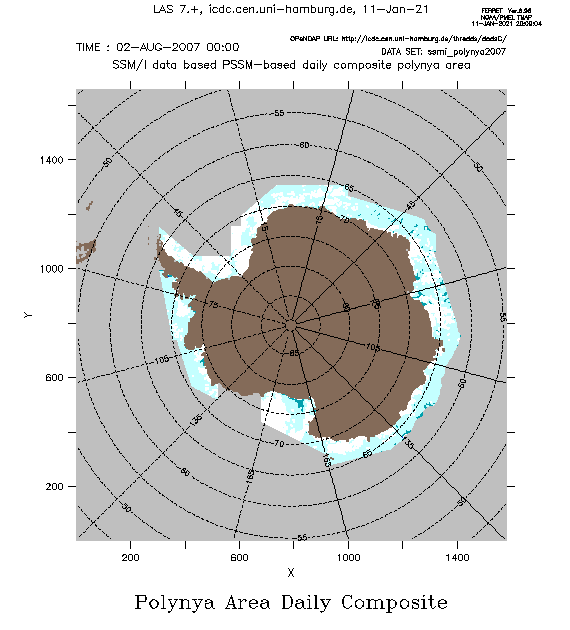
Data of the Special Sensor Microwave / Imager (SSM/I) were used to identify and map polynyas; these are areas of open water and/or thin (< 20 cm) sea ice in regions of typically thick sea ice.
For this purpose a classification method was applied to gridded 37 GHz and 85 GHz SSM/I brightness temperature measurements of each SSM/I overpass to distinguish between three surface types: thick ice, thin ice, and open water. Polynya maps were obtained for each SSM/I overpass (inter-sensor difference corrected data of DMSP-platforms f10, f13 and f15), quality controlled and merged to maps showing the daily winter-time polynya distribution. The offered data set (version 01) contains a mean daily composite of the polynya distribution as well as an estimate of the minimum polynya distribution - as a conservative estimate of a likely lower bound of the polynya area. The basic algorithm is described in Markus and Burns (1995) and Hunewinkel et al. (1998). The modifications that were required to obtain a circum-Antarctic polynya distribution and further details can be found in Kern et al. (2007) and the project report.
From May 2016 until November 2022 polynya maps were created from single swath DMSP-f17 and f18 SSM/IS observations and offered via ICDC. Upon request we offer data of the polynya distribution for every subregion used, e.g. the Ross Sea, also as a daily composite or for every SSM/I overpass (depending on the region up to 6/day) for the same time period on the same grid with the same grid resolution also in netCDF format.
This data set is a CliSAP/KlimaCampus product.
Last update of data set at ICDC:
Parameters
| Name | Unit | Values |
|---|---|---|
| Mean / Minimum polynya distribution | none |
|
| Number of satellite overpasses | 1 / day | - |
Coverage, spatial and temporal resolution
Period and temporal resolution:
- 1992 - 2008, May to September, respectively
- Daily
Coverage and spatial resolution:
- Southern hemisphere (without northern part of Antarctic Peninsula and the region between 130°W and 155°W)
- Spatial resolution: 5 km x 5 km; polar-stereographic grid, tangential plane at 70°S
- Geographic Longitude: -180°E to 180°E
- Geographic Latitude: about 40°S to 90°S
- Dimension: 1520 columns x 1660 rows
- Altitude: 0.0 m
Format:
- NetCDF
Data quality
The data set does not contain uncertainty estimates. The daily polynya distribution data available upon request for the single sub-regions contain besides the mean daily composite polynya distribution also an estimate of the maximum and the minimum polynya distribution.
According to Markus and Burns (1995) changes in polynya area as small as 50 km² can be identified with a mean accuracy of the obtained polynya area of 80 km². We suggest a more conservative estimate of both numbers of 200 km². Error contributions come from (see also: Publications)
- inaccurate / too old coastline**
- dynamically changing shelf ice borders**
- influence of fast ice, shelf ice, and ice bergs on the classification
- weather influence
- Smearing of strong contrasts due to coarse spatial resolution
**) In order to mitigate this influence, a new landmask with 5 km grid resolution was created from clear-sky NOAA-AVHRR imagery. This landmask is included in the data set. It is kind of a dynamic coastline as it has been updated every two years for 1992-2004.
Contact
Stefan Kern
ICDC / CEN / University of Hamburg
E-Mail: stefan.kern (at) uni-hamburg.de
References
Literature:
- Markus, T., and B. Burns, A method to estimate subpixel‐scale coastal polynyas with satellite passive microwave data, 1995, https://doi.org/10.1029/94JC02278
- Hunewinkel, T., et al., Improved Determination of the Sea Ice Edge with SSM/I Data for Small-Scale Analyses, IEEE TRANSACTIONS ON GEOSCIENCE AND REMOTE SENSING, VOL. 36, NO. 5, 1998 (pdf, not barrier-free)
- Kern, S. et al Polynya Signature Simulation Method polynya area in comparison to AMSR-E 89 GHz sea-ice concentrations in the Ross Sea and off the Ade´lie Coast, Antarctica, for 2002–05: first results, Annals of Glaciology, 46, 2007 (pdf, not barrier-free)
- Kern, S., Wintertime Antarctic coastal polynya area: 1992–2008, Geophysical Research LettersVolume 36, Issue 14, 2009, https://doi.org/10.1029/2009GL038062 (pdf, not barrier-free)
- Stammer, D. et al, Antarctic coastal polynyas as observed with passive satellite sensors: Total area, ice production, brine release, and thin-ice thickness and area for the period 1992-2006, Final Project Report, 2008, chapter 1-7, chapter 8-I, chapter 8-II (pdf, not barrier-free)
Data citation
Please cite the data as follows:
Kern, S. (2012) Antarctic daily winter-time polynya distribution from SSM/I brightness temperature data, (years used), Integrated Climate Data Center (ICDC), CEN, University of Hamburg, Hamburg, Germany, Digital Media.
Kern, S. et al Polynya Signature Simulation Method polynya area in comparison to AMSR-E 89 GHz sea-ice concentrations in the Ross Sea and off the Ade´lie Coast, Antarctica, for 2002–05: first results, Annals of Glaciology, 46, 2007
and with the following acknowledgments:
Thanks to ICDC, CEN, University of Hamburg for data support.
