Ocean
Parameters for ocean properties:
- Sea surface height (SSH)
- Salinity
- Temperature
- Tides in the ocean
- Ocean Currents
- Ocean Color (e.g. chlorophyll concentration)
- Ocean Climatologies
- CoastDat
- Bathymetry (see Land - Topography)
- Data portal of the DAM
Sea surface height (SSH)

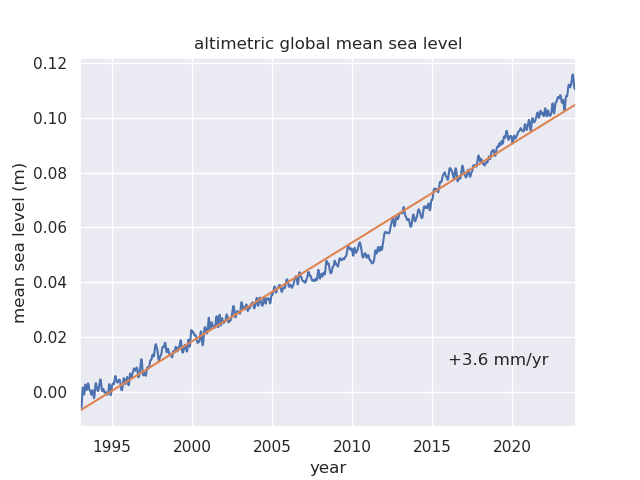
Precise measurements of sea surface height (SSH) are a prerequisite for the quantification of the mean sea level altitude and change. Changes in global mean sea level are among the most important indicators of climate change. The derivation of SSH using satellite measurements is done by measuring the signal propagation time between the satellite and the ocean surface. The SSH is given in meters (m).
SSH data:
- from satellite measurements from C3S (former AVISO)
- Data from AVISO Website, https://www.aviso.altimetry.fr/en/data/products/ocean-indicators-products/mean-sea-level.html
Salinity
Salinity data of the ocean:
- Ocean salinity at different depths from in-situ observations of the global ocean from 1945-2012 from ISHII
- Ocean salinity at different depths from in-situ observations of the global ocean for 2005 to 2021 from Levitus
- Ocean salinity at different depths from in-situ observations from historical hydrographic data from BSH
- Ocean salinity at different depths from in-situ observations using CTD profiles from IfM Collaborative Research Centre Cruises
- Ocean salinity (global) at different depths via assimilation / synthesis of observations into / with an ocean model (Oceansyntheses / Oceanreanalyses of the EasyInit-project) e.g. ECMWF OceanReAnalysis ORAS (1958-2017)
- Ocean salinity (global) derived from satellite observations: ESA-CCI sea-surface salinity (2010-2019)
- Salinity at different depths of the North Sea from KLIWAS North Sea Climatology
- Salinity at different depths of the North and Baltic Seas from Baltic and North Seas Climatology (BNSC)
- Near surface salinity (and temperature) measured by SVP drift buoy in the northeast Atlantic and southwest Pacific (SVP drift buoy data set)
- Ocean salinity at different depths from in-situ observations in the global ocean from 1900-2023 from MetOffice: EN4
- Argo Float Data - e.g.: http://www.argo.net/
- New data set of the mixed-layer depth: http://mixedlayer.ucsd.edu (see: Holte, J., et al., 2017, An Argo mixed-layer climatology and database)
- UDASH - Unified Database for Arctic and Subarctic Hydrography 1980-2015 north of 65°N (see Behrendt et al., ESSD, 10, 2018)
Temperature
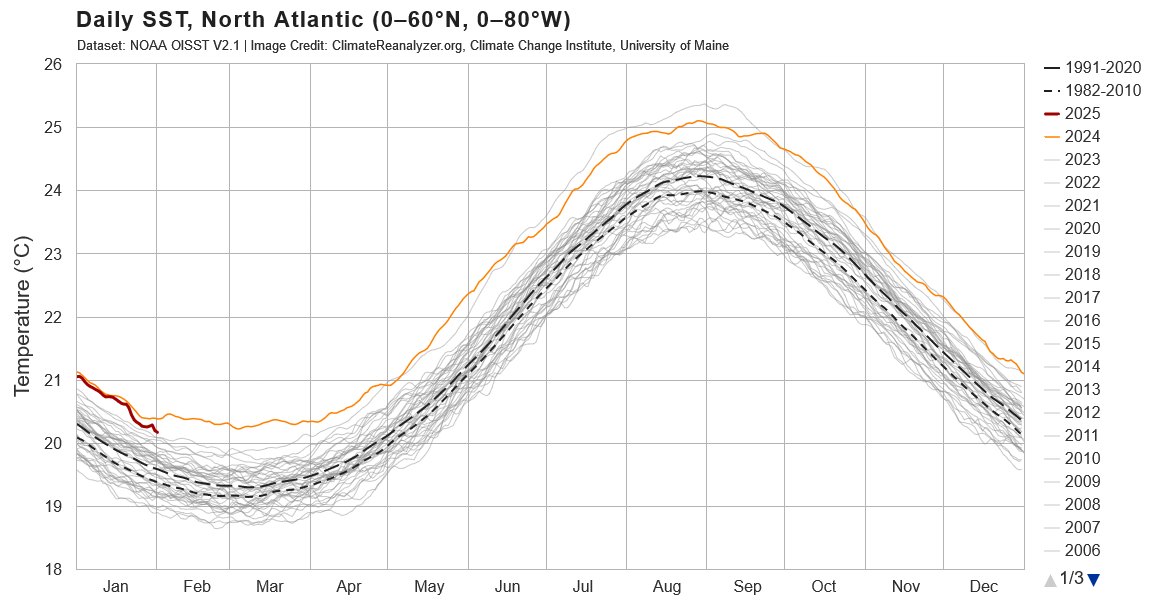
The temperature distribution in the ocean and at the ocean surface is, together with the salinity, a pre-requisite for the understanding of the vertical layering in the ocean, the general ocean circulation, and the amount and variability of the ocean heat content. The ocean (or sea) surface temperature (SST) determines the ocean-atmosphere heat exchange. The SST can be measured by radiometers operating in the infrared (Advanced Very High Resolution Radiometer, AVHRR) or in the microwave part of the electromagnetic spectrum (Advanced Microwave Scanning Radiometer, AMSR-E). Advantage of using AVHRR: Finer spatial resolution; advantage of using AMSR-E: independent of clouds. Within the water column temperatures are typically measured by classical thermometers that used in oceanography (e.g. filled with Xylol), or thermoelectric / with thermistors. Temperature data provided via the ICDC are given in units Kelvin (K) or degrees Celsius (°C).
Temperature data of the ocean
Satellite Remote Sensing:
- SST (+ anomalies + global mean) from AVHRR (OISST, previously Reynolds data set, 1982-2024)
- SST from AMSR-E (REMSS data set, 2002-2011)
- SST from HOAPS at CMSAF
- SST from MODIS (2000-2024)
Climatologies:
- Monthly mean SST (+ global mean) and sea ice cover (HadISST1)
- SST anomalies relative to 1961-1990: HadCRUT
Ocean temperature profiles:
- Temperature at different depths from in-situ observations using XBT, MBT and CTD profiles from IfM Collaborative Research Centre Cruises
- Temperature at different depths from in-situ observations of the global ocean from 1945-2012 from ISHII
- Temperature at different depths from in-situ observations of the global ocean from 1955-2021 from Levitus
- Temperature at different depths from in-situ observations from historical hydrographic data from BSH
- Potential temperature (global) at different depths via assimilation / synthesis of observations into / with an ocean model (Oceansyntheses / Oceanreanalyses of the EasyInit-project) e.g. ECMWF OceanReAnalysis ORAS (1958-2017)
- Temperature of the North Sea at different depths from KLIWAS North Sea Climatology
- Temperature of the North and Baltic Seas at different depths from Baltic and North Seas Climatology (BNSC)
- Ocean temperature at different depths from in-situ measurements in the global ocean from 1900-2023 from MetOffice: EN4
- UDASH - Unified Database for Arctic and Subarctic Hydrography 1980-2015 north of 65°N (see Behrendt et al., ESSD, 10, 2018)
The above-listed data sets based on satellite remote sensing are, without exception, long-term data sets. These may suffer from a relatively coarse spatial resolution. However, upon request (use contact) we are providing also finer spatially resolved (e.g. 1 km) SST data sets.
Buoy & Float Observations:
- Buoys drifting or moored in the ocean permit to carry out observations of the water temperature close to the surface and of additional parameters as for instance the significant wave height or meteorological parameters. We recommend the National Data Buoy Center (NDBC) for getting an overview about and for downloading such observations.
- Argo Float Data - e.g.: http://www.argo.net/
- New data set of the mixed-layer depth: http://mixedlayer.ucsd.edu (see: Holte, J., et al., 2017, An Argo mixed-layer climatology and database)
Tides in the ocean
Tides in the ocean play a fundamental role for a number of processes, e.g., horizontal and vertical mixing of water masses, transport of suspended matter and plankton, and intensification or weakening of water mass formation processes, sea ice deformation and formation. Ocean tides add therefore not just a component to the ocean currents but influence it's temperature, its salinity, the concentrations of suspended matter and chlorophyll, and the water level - particularly on ocean shelves, along coasts and in estuaries such as that of the Elbe river. Accordingly, accurate knowledge of the ocean tides is also important from an economical view point, because it helps (i) to protecting the coasts against storm surges, (ii) to enabling safe marine transportation in estuaries and along coasts, and last but not least (iii) to ensuring safe holidays in coastal areas with large tidal amplitude.
Ocean tides are generated by the attraction forces between Earth, Moon and Sun. They are typically described by their amplitude (increase or decrease of the water level relative to the mean water level, i.e., high tide and low tide) and their phase (the temporally varying, periodically occurrence of high and low tide).
Amplitude and phase of the ocean tides can be estimated from in-situ water level observations at tide gauges. Satellite observations of the sea surface height (SSH) (via measuring the distance between the satellite and the ocean surface), e.g. with radar altimeters such as TOPEX/Poseidon or Jason-1, allow to estimating the tidal amplitude and phase. Because of the assumptions that have to be made for this estimation and the uncertainties these observational data sets are often combined in a data assimilation model in order to receive the best results - at least for large-scale and long-term investigations.
Here we offer a data set of ocean tides derived via a tidal model optimized with data assimilation.
Ocean Color
The so-called ocean color provides information about, e.g., biological activity and content of suspended matter near the water surface. This parameter is retrieved from observations of the sunlight reflected by the water at different frequencies (i.e. with a certain spectral resolution). Such data are provided by satellite sensors as the Medium Resolution Imaging Spectrometer (MERIS), the Moderate Resolution Imaging Spectroradiometer (MODIS), and the Sea-viewing Wide Field-of-View Sensor (SeaWIFS). A common parameter given in the context is the concentration of Chlorophyll-a.
Data of the ocean color / chlorophyll-a concentration:
- with moderate spatial resolution: GlobColor
- via the Plymouth Marine Laboratory: ChloroGIN
- at high resolution (4 km / 9 km, daily, monthly): OceanColorWeb
- from MODIS (2000/2002 to 2024)
Ocean Currents
Ocean currents are caused by vertical and horizontal density gradients in the ocean. Knowledge of location, flow speed, direction and continuity as well as the causing gradients is fundamental for understanding and predicting oceanic processes and their variability like the Global Ocean Conveyer Belt or the Gulf Stream.
Precise measurements of the geostrophic surface current velocity are a prerequisite for the verification of eddy-resolving numerical ocean models and a better understanding of transport processes near the ocean surface.
In order to estimate such velocities and their anomalies from, e.g. satellite altimeter observations of the ocean surface, it is usually required to interpolate and/or average the input data. This is different for tandem missions such as the Jason-1 - TOPEX/POSEIDON tandem mission which data have been used to create the product offered below.
Ocean current data:
- Ocean surface currents (OSCAR, 0.25°, 19930101 - 20241204)
- Geostrophic Surface Velocity Anomalies from Jason-1 - TOPEX/POSEIDON tandem mission
- Surface Velocity and its Anomaly (AVISO, 0.25°, 1993 - 2022)
- from Oceansyntheses / -reanalyses with an ocean model within the framework of EasyInit (e.g. ECMWF OceanReAnalysis ORAS)
Ocean Climatologies
In-situ observations of physical ocean parameters like salinity, temperature, density, and currents are a pre-requisite for the correct interpretation and analyses of satellite remote sensing data. Another aspect is the development, initialization, and assimilation of ocean models and the validation of their results. Data collections and climatologies containing such paramters are therefore quite important; probably the most well known of these has been released in the framework of the World Ocean Circulation Experiment (WOCE).
- World Ocean Climatology: World Ocean Circulation Experiment (WOCE) Climatology
- Update of WOCE Climatology: WOCE / Argo Global Hydrographic Climatology (WAGHC)
- Atlantic Atlas: WOCE Atlas
CoastDat
CoastDat offers hindcast- and future-scenario model calculations for the system ocean-atmosphere-cost.
- Model data via CoastDat


