Sea surface temperature from OISST
Topics
- Access
- Description
- Parameters
- Coverage, spatial and temporal resolution
- Data quality
- Contact person
- References
- Data citation
Access
UNRESTRICTED:
- View monthly OISST data at LAS
- Get daily OISST data from NOAA's NCDC
- Get single monthly OISST data via HTTP (get all with wget-Skript)
- Access monthly OISST data via OPeNDAP
RESTRICTED: This link to the data set is only available for a restricted user group. The data set is only accessible in CEN/MPI net or accessible from external nets with a customer account. Please contact ICDC if you would like to access this data from outside the network.
- View daily OISST data at LAS
- Access daily OISST data via OPeNDAP
- Data access via file system: /data/icdc/ocean/reynolds_sst
Description
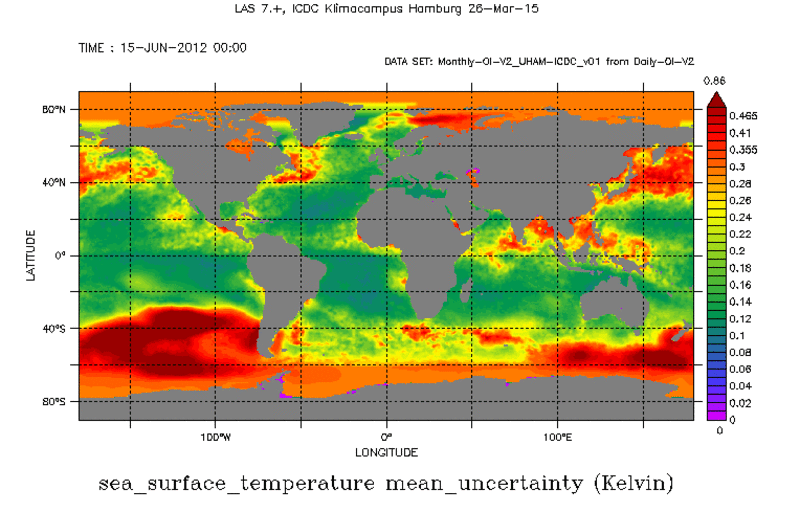
We offer here Version v2.1 of the OISST (previously: Reynolds SST) data set. It comprises one sea surface temperature (SST) analysis product that has been developed using optimum interpolation (OI) --> OISST data set. This product is based on Advanced Very High Resolution Radiometer (AVHRR) infrared satellite SST data. The product also is based on in situ data from ships and buoys and include a large-scale adjustment of satellite biases with respect to the in situ data. Hence this SST data set has to be regarded as a bulk SST data set.
More information about the data set is given at NOAA's NCDC OISST website, in the Technical Note by Reynolds, and the publications under references. See also further down in the data quality section.
In addition M. Meyer (CEN), and S. Kern (ICDC) have computed the monthly mean SST for 1982-2025 and offer these data at ICDC, see Fig. 2(d) .
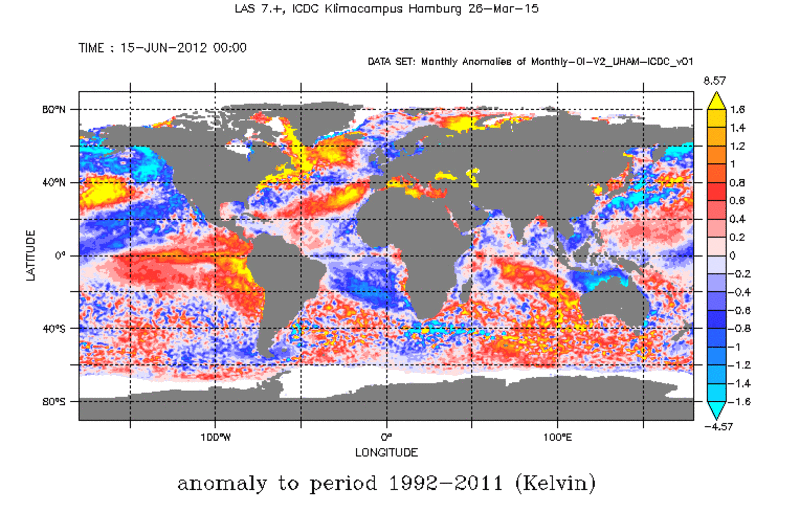
On top of this ICDC (by M. Meyer/S. Kern) has computed anomalies of the monthly mean SST relative to two reference periods: 1982-2001 and 1992-2011 and also offers these anomalies for 1982-2025. We note that the daily data already contain anomalies. These are computed relative to a longer period (1971-2000) but over this period the reference data set is based on a less consistent data source with less consistent spatial resolution.
 |
 |
 |
 |
 |
 |
 |
 |
 |
 |
 |
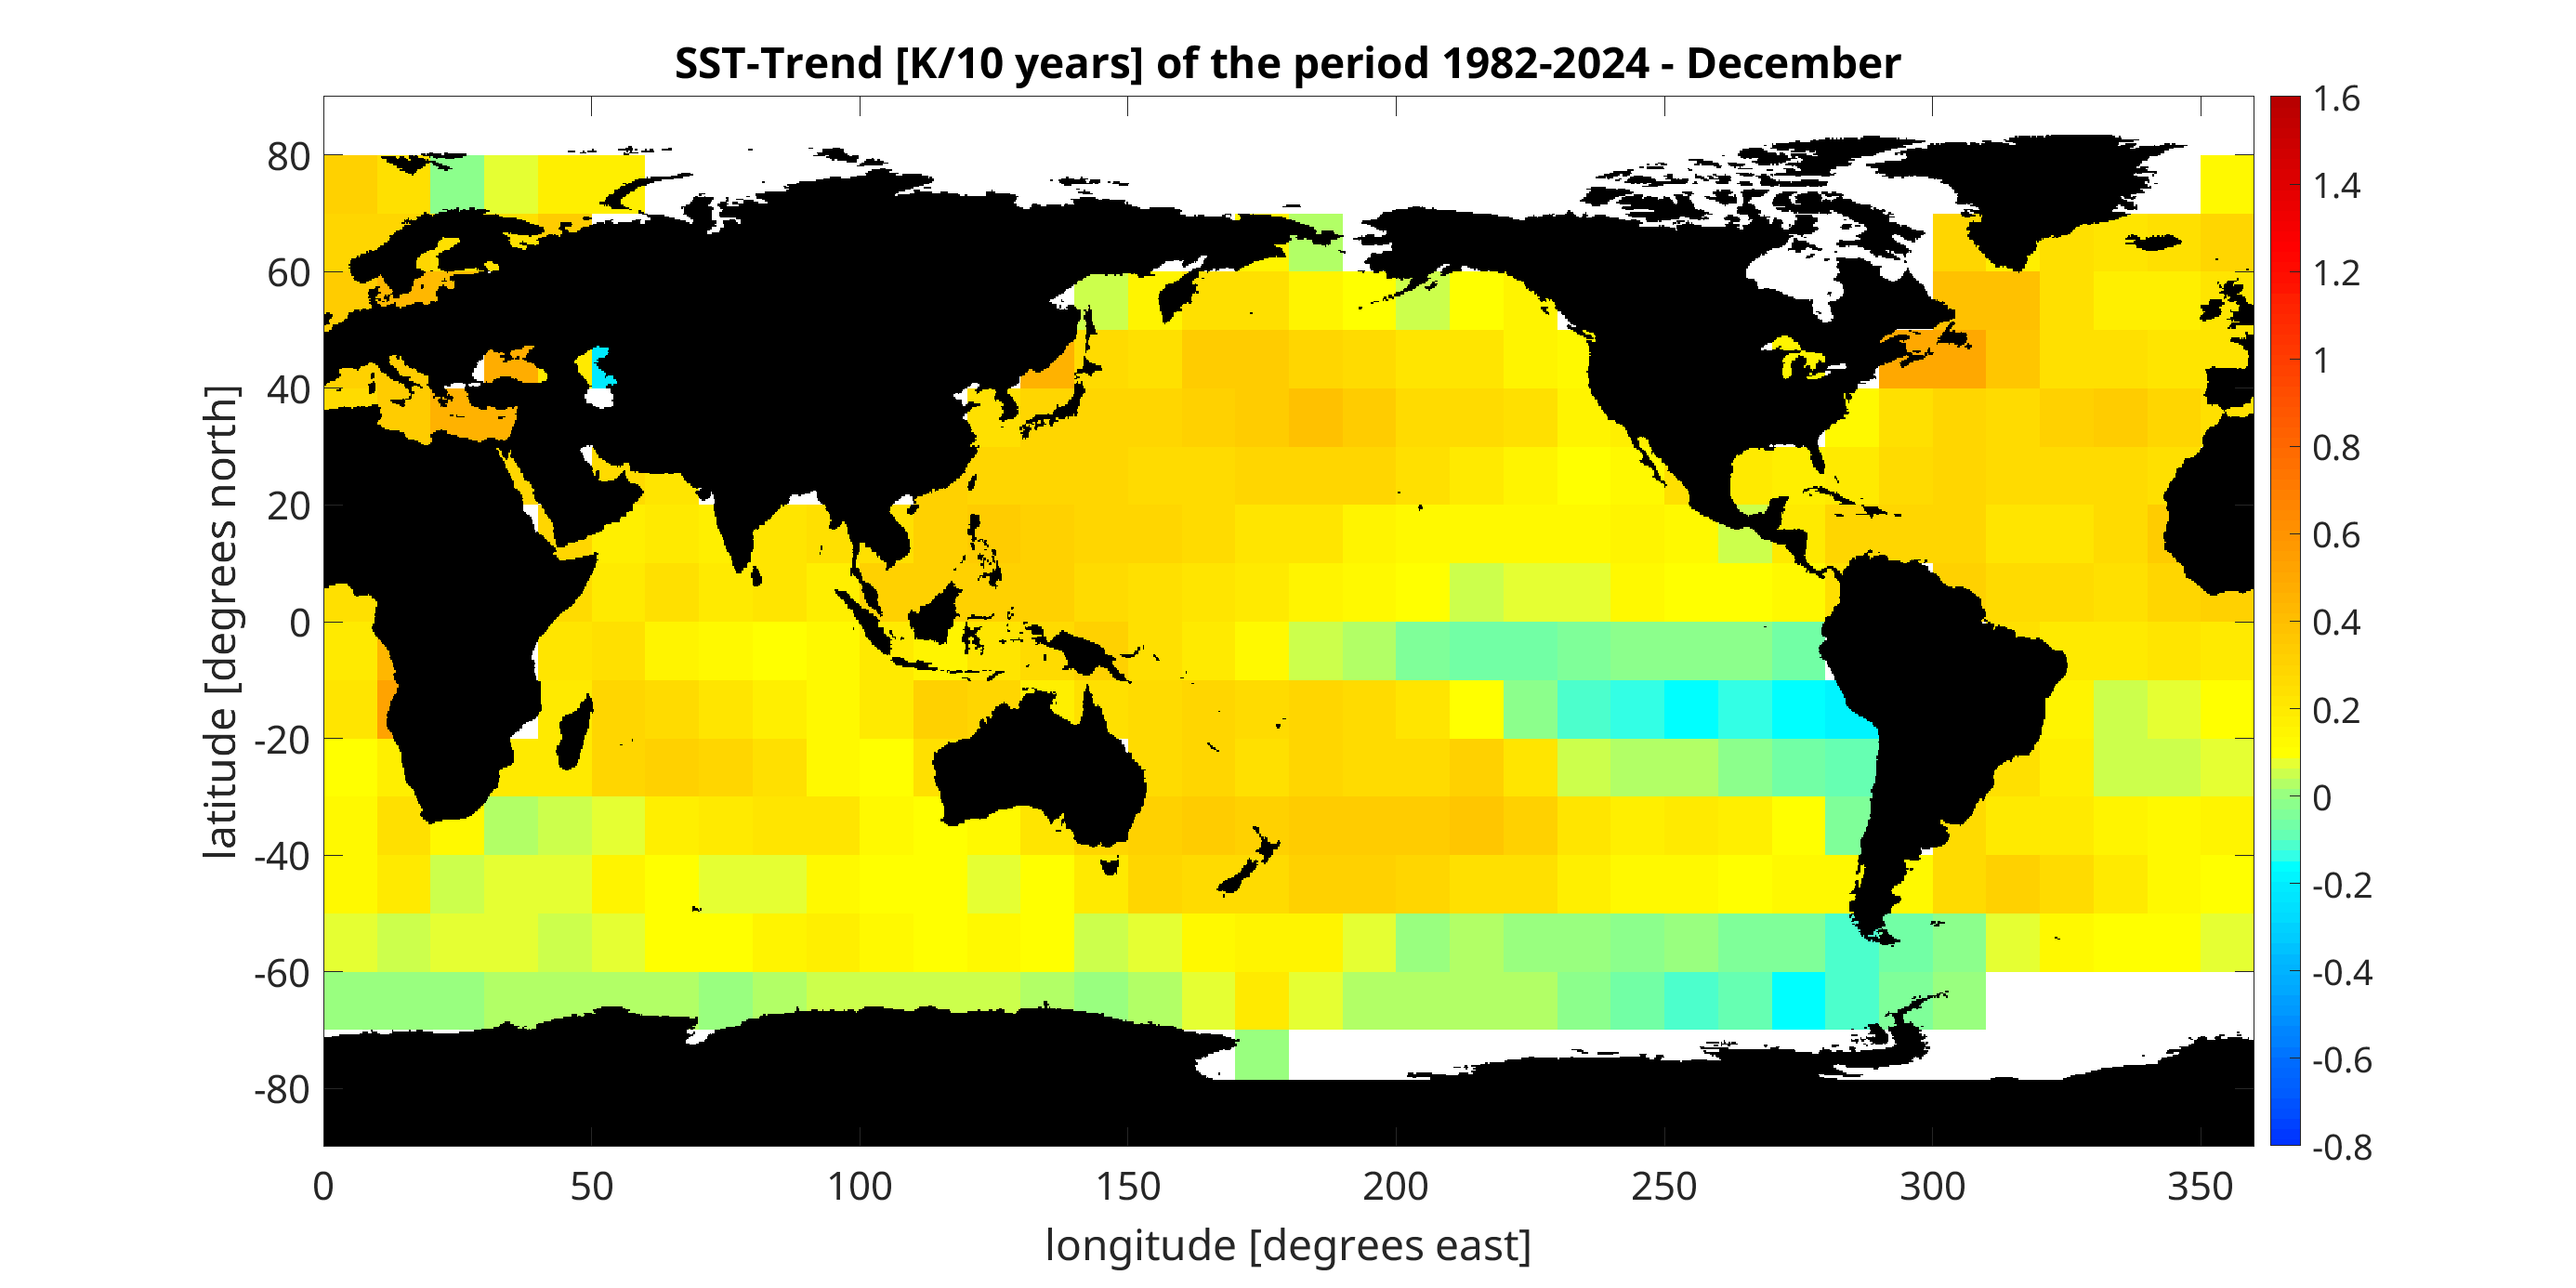 |
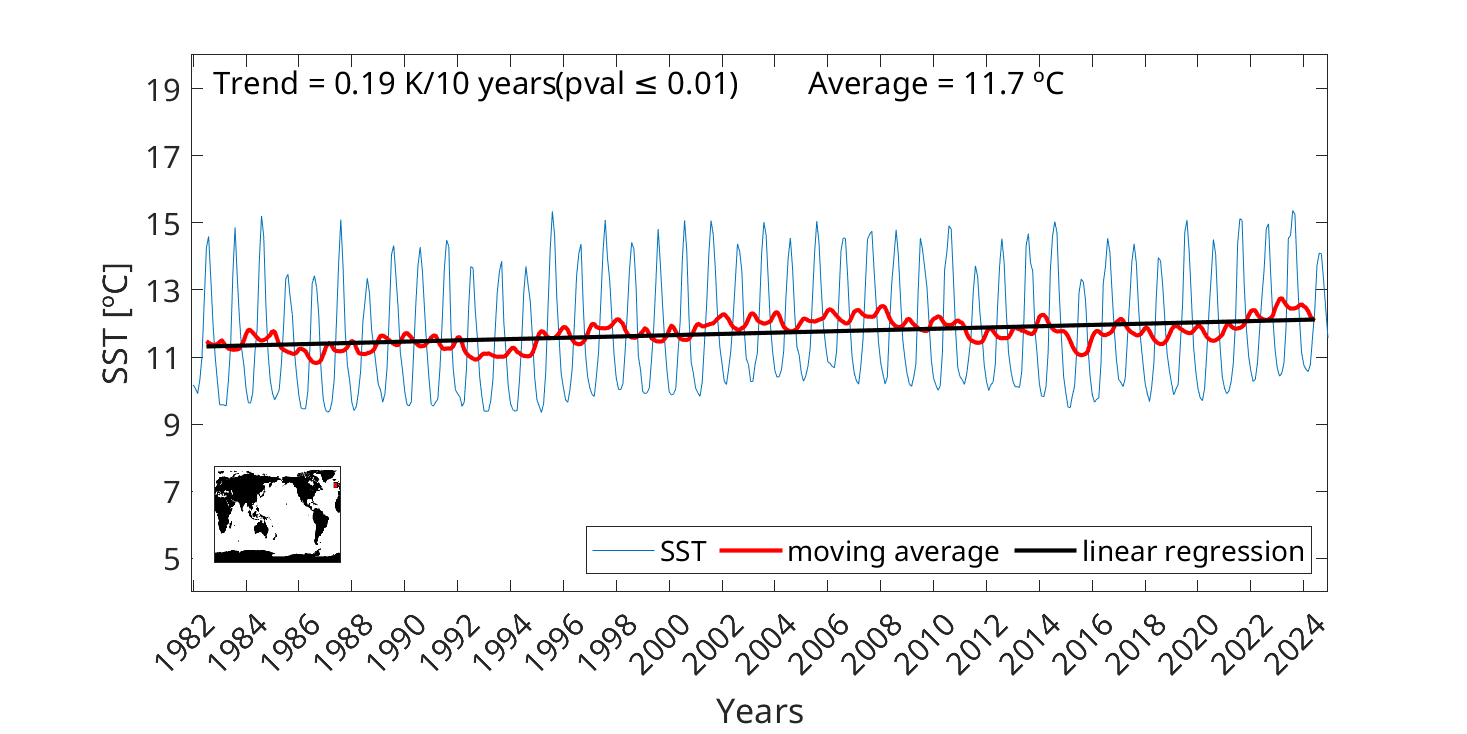
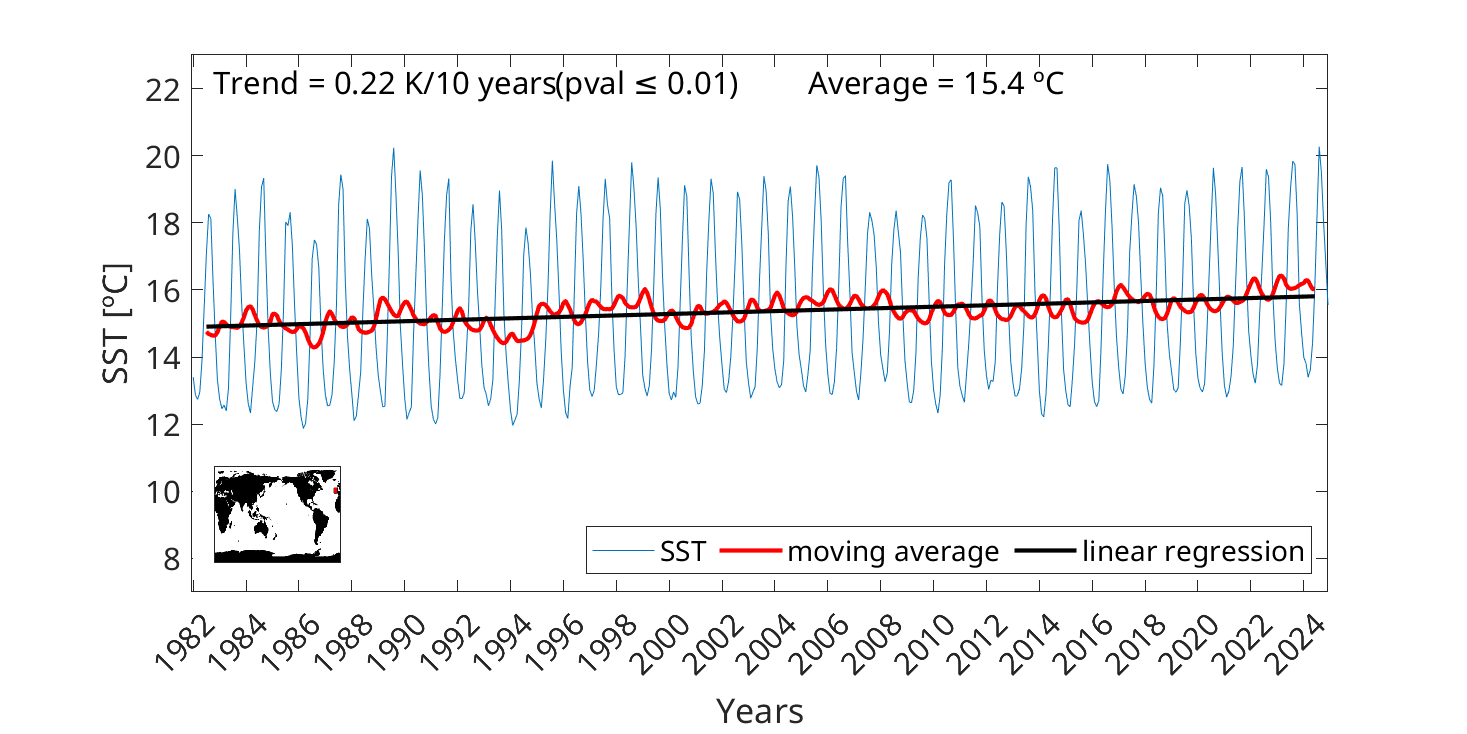
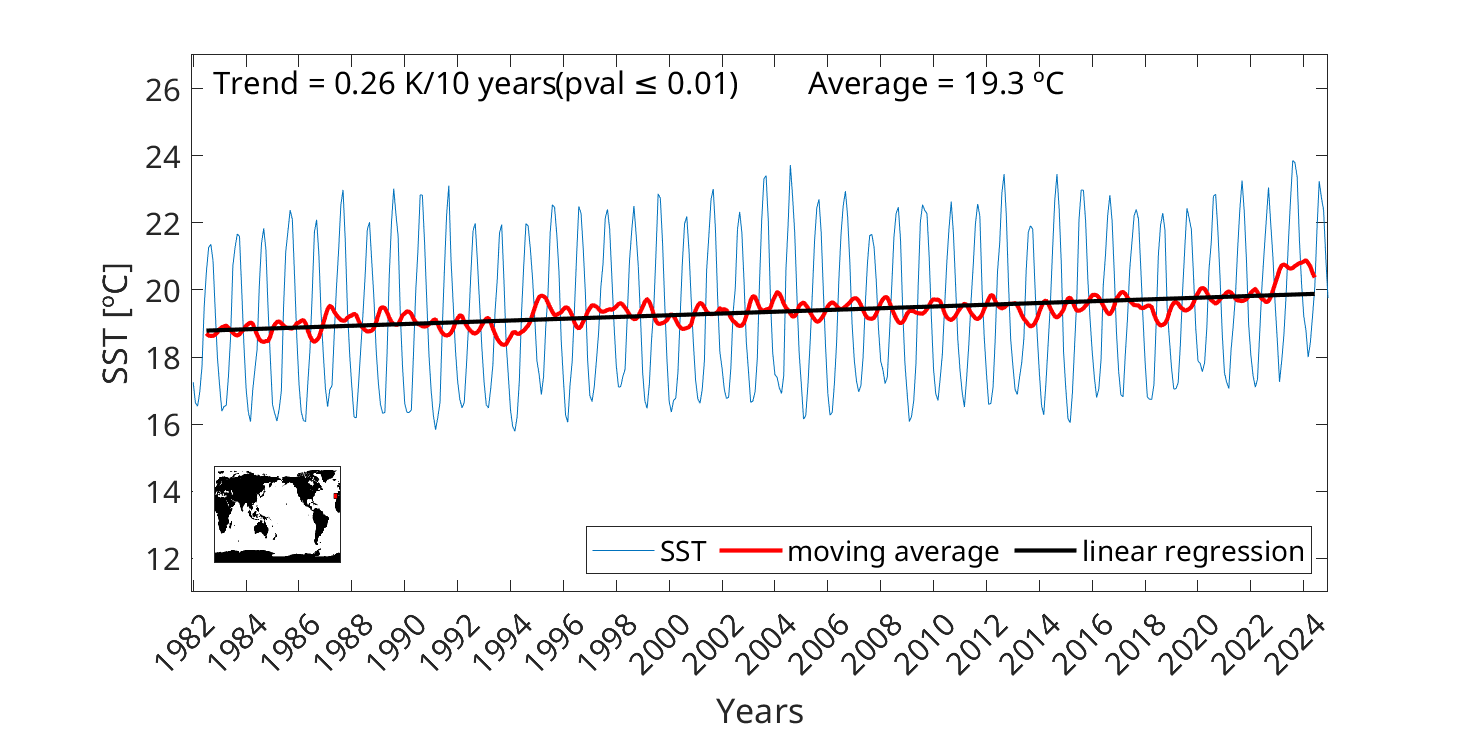
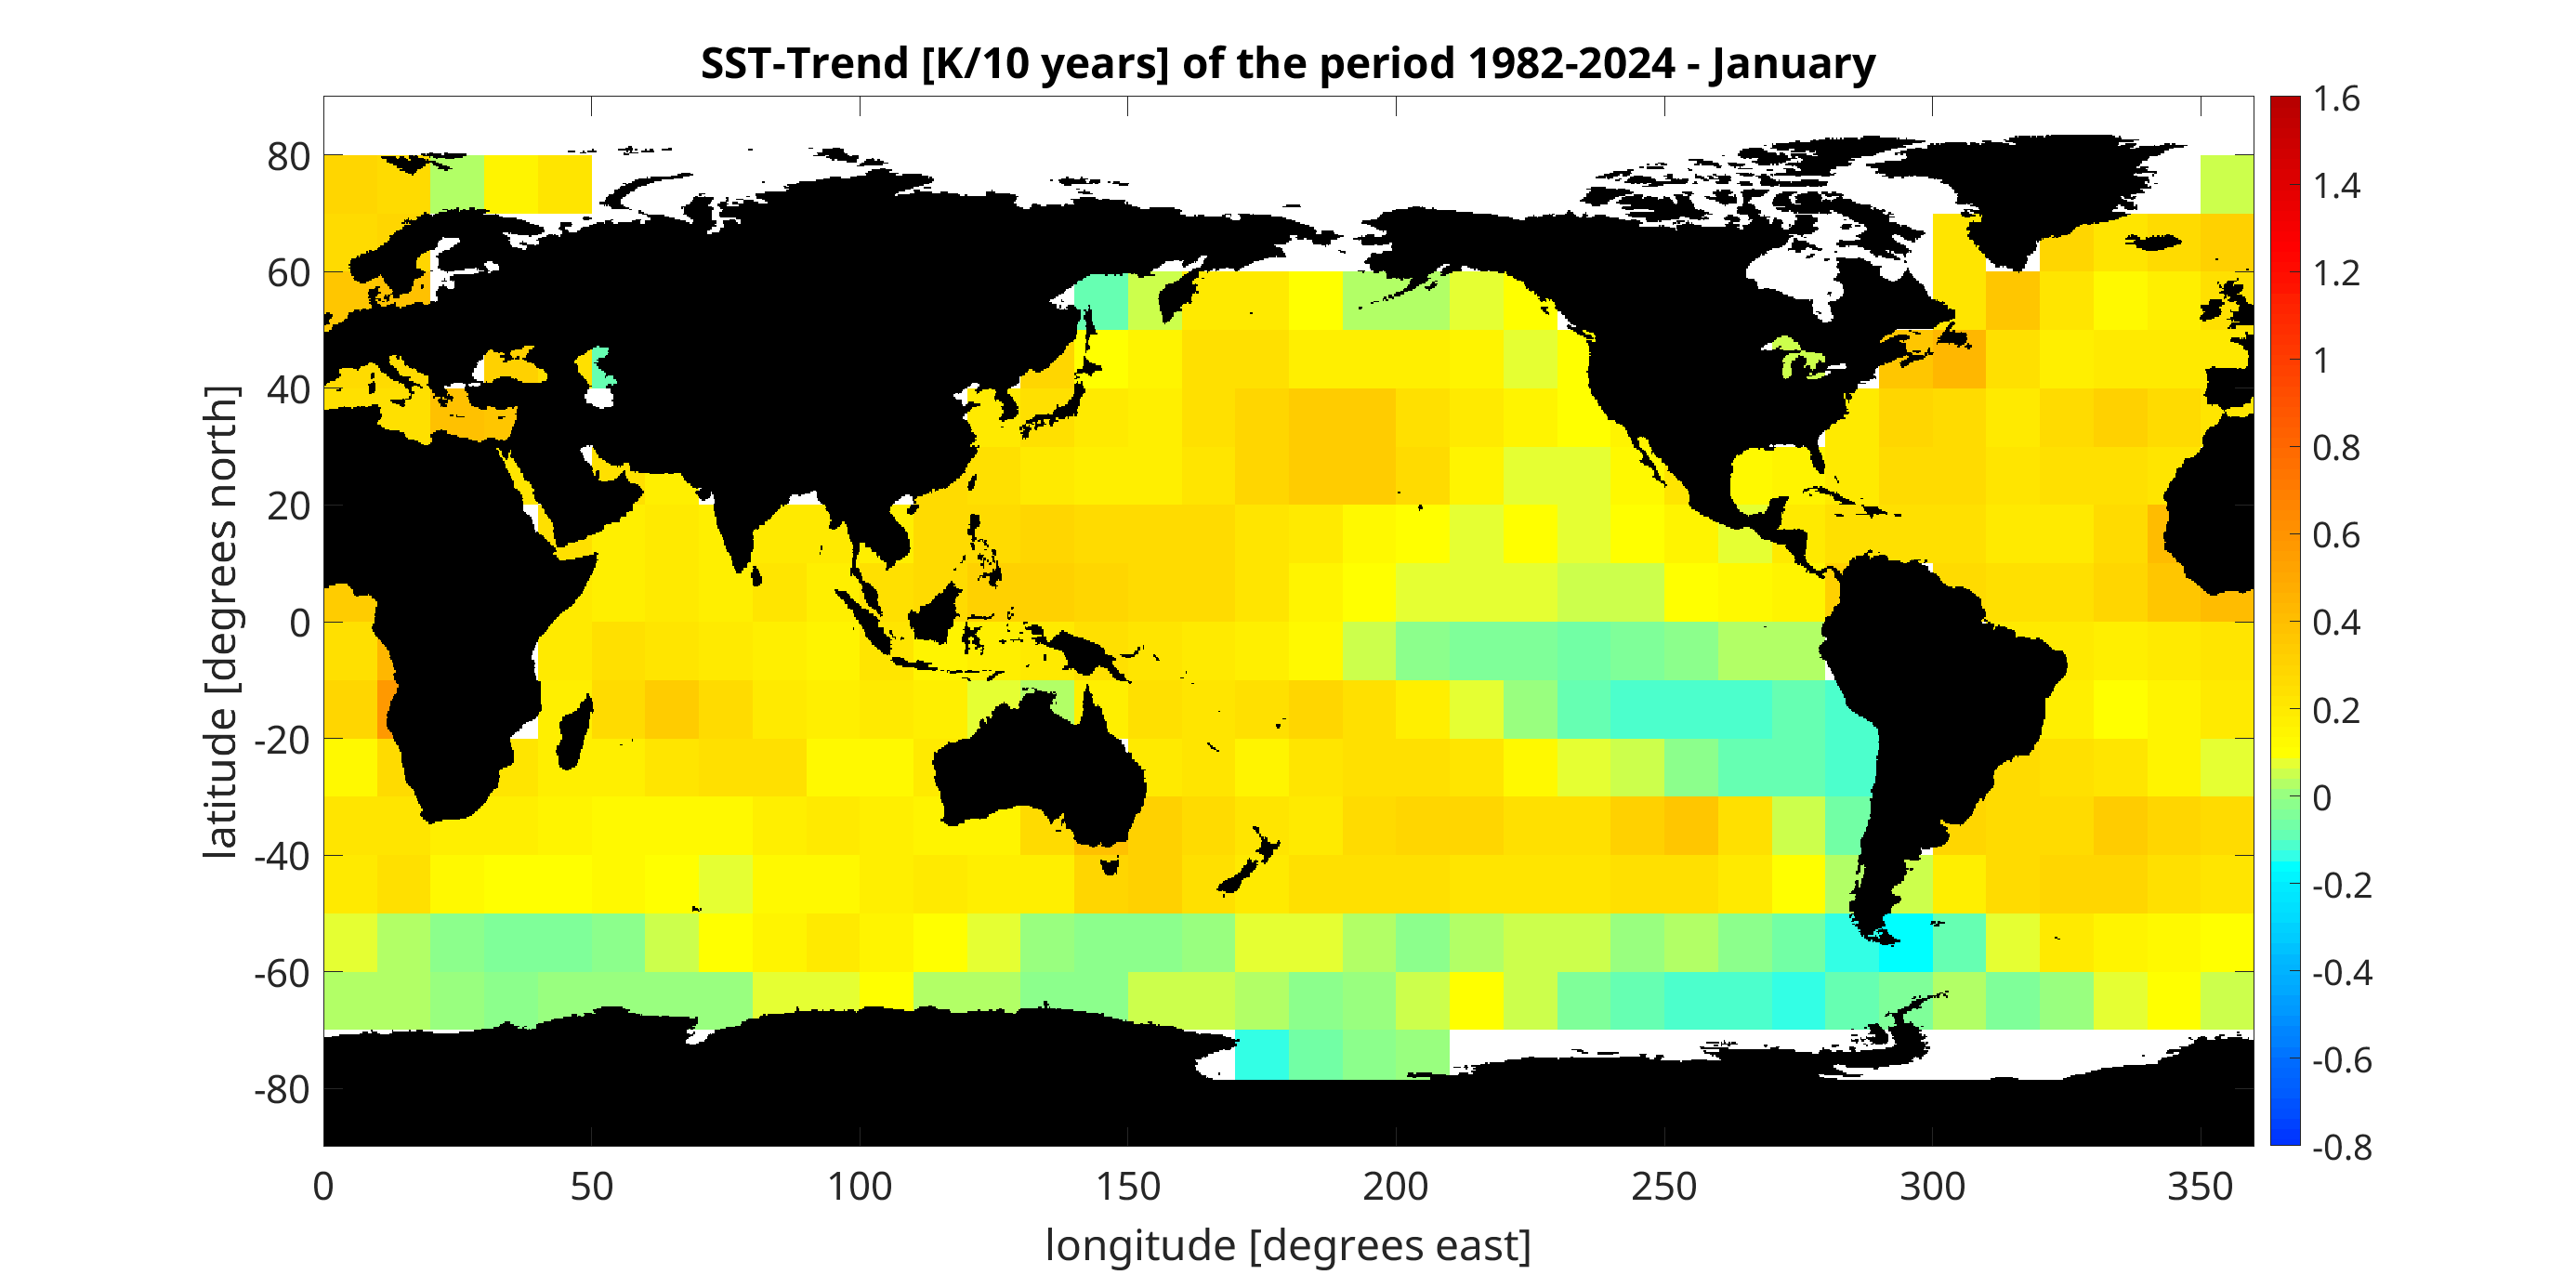
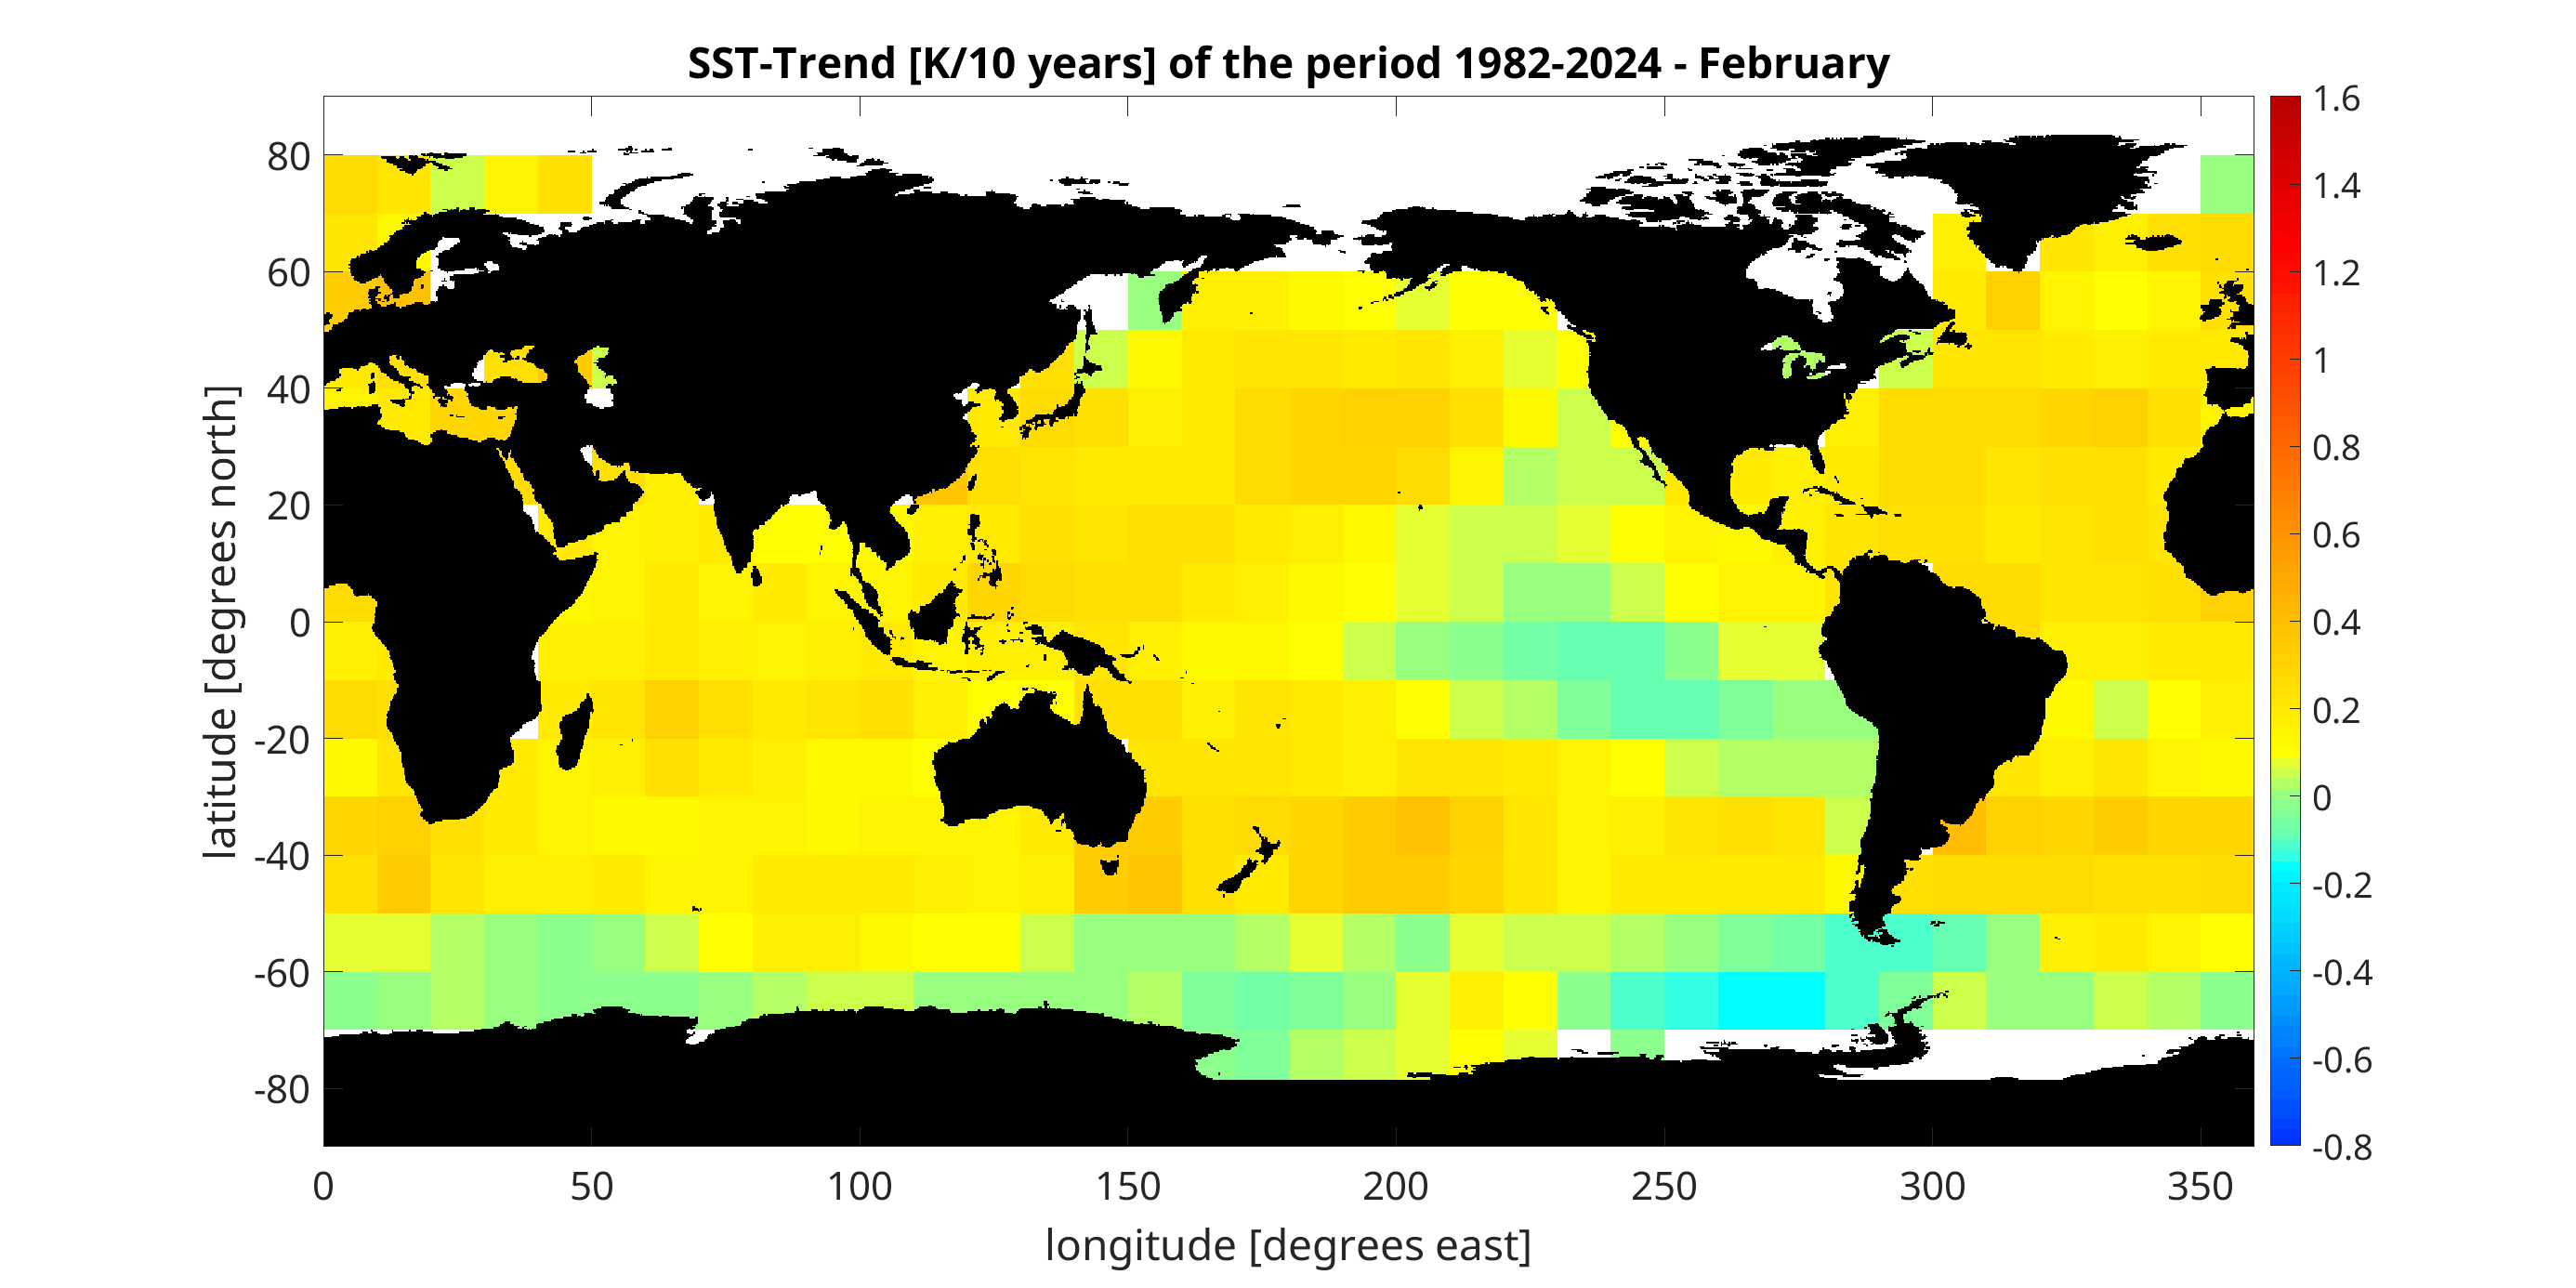
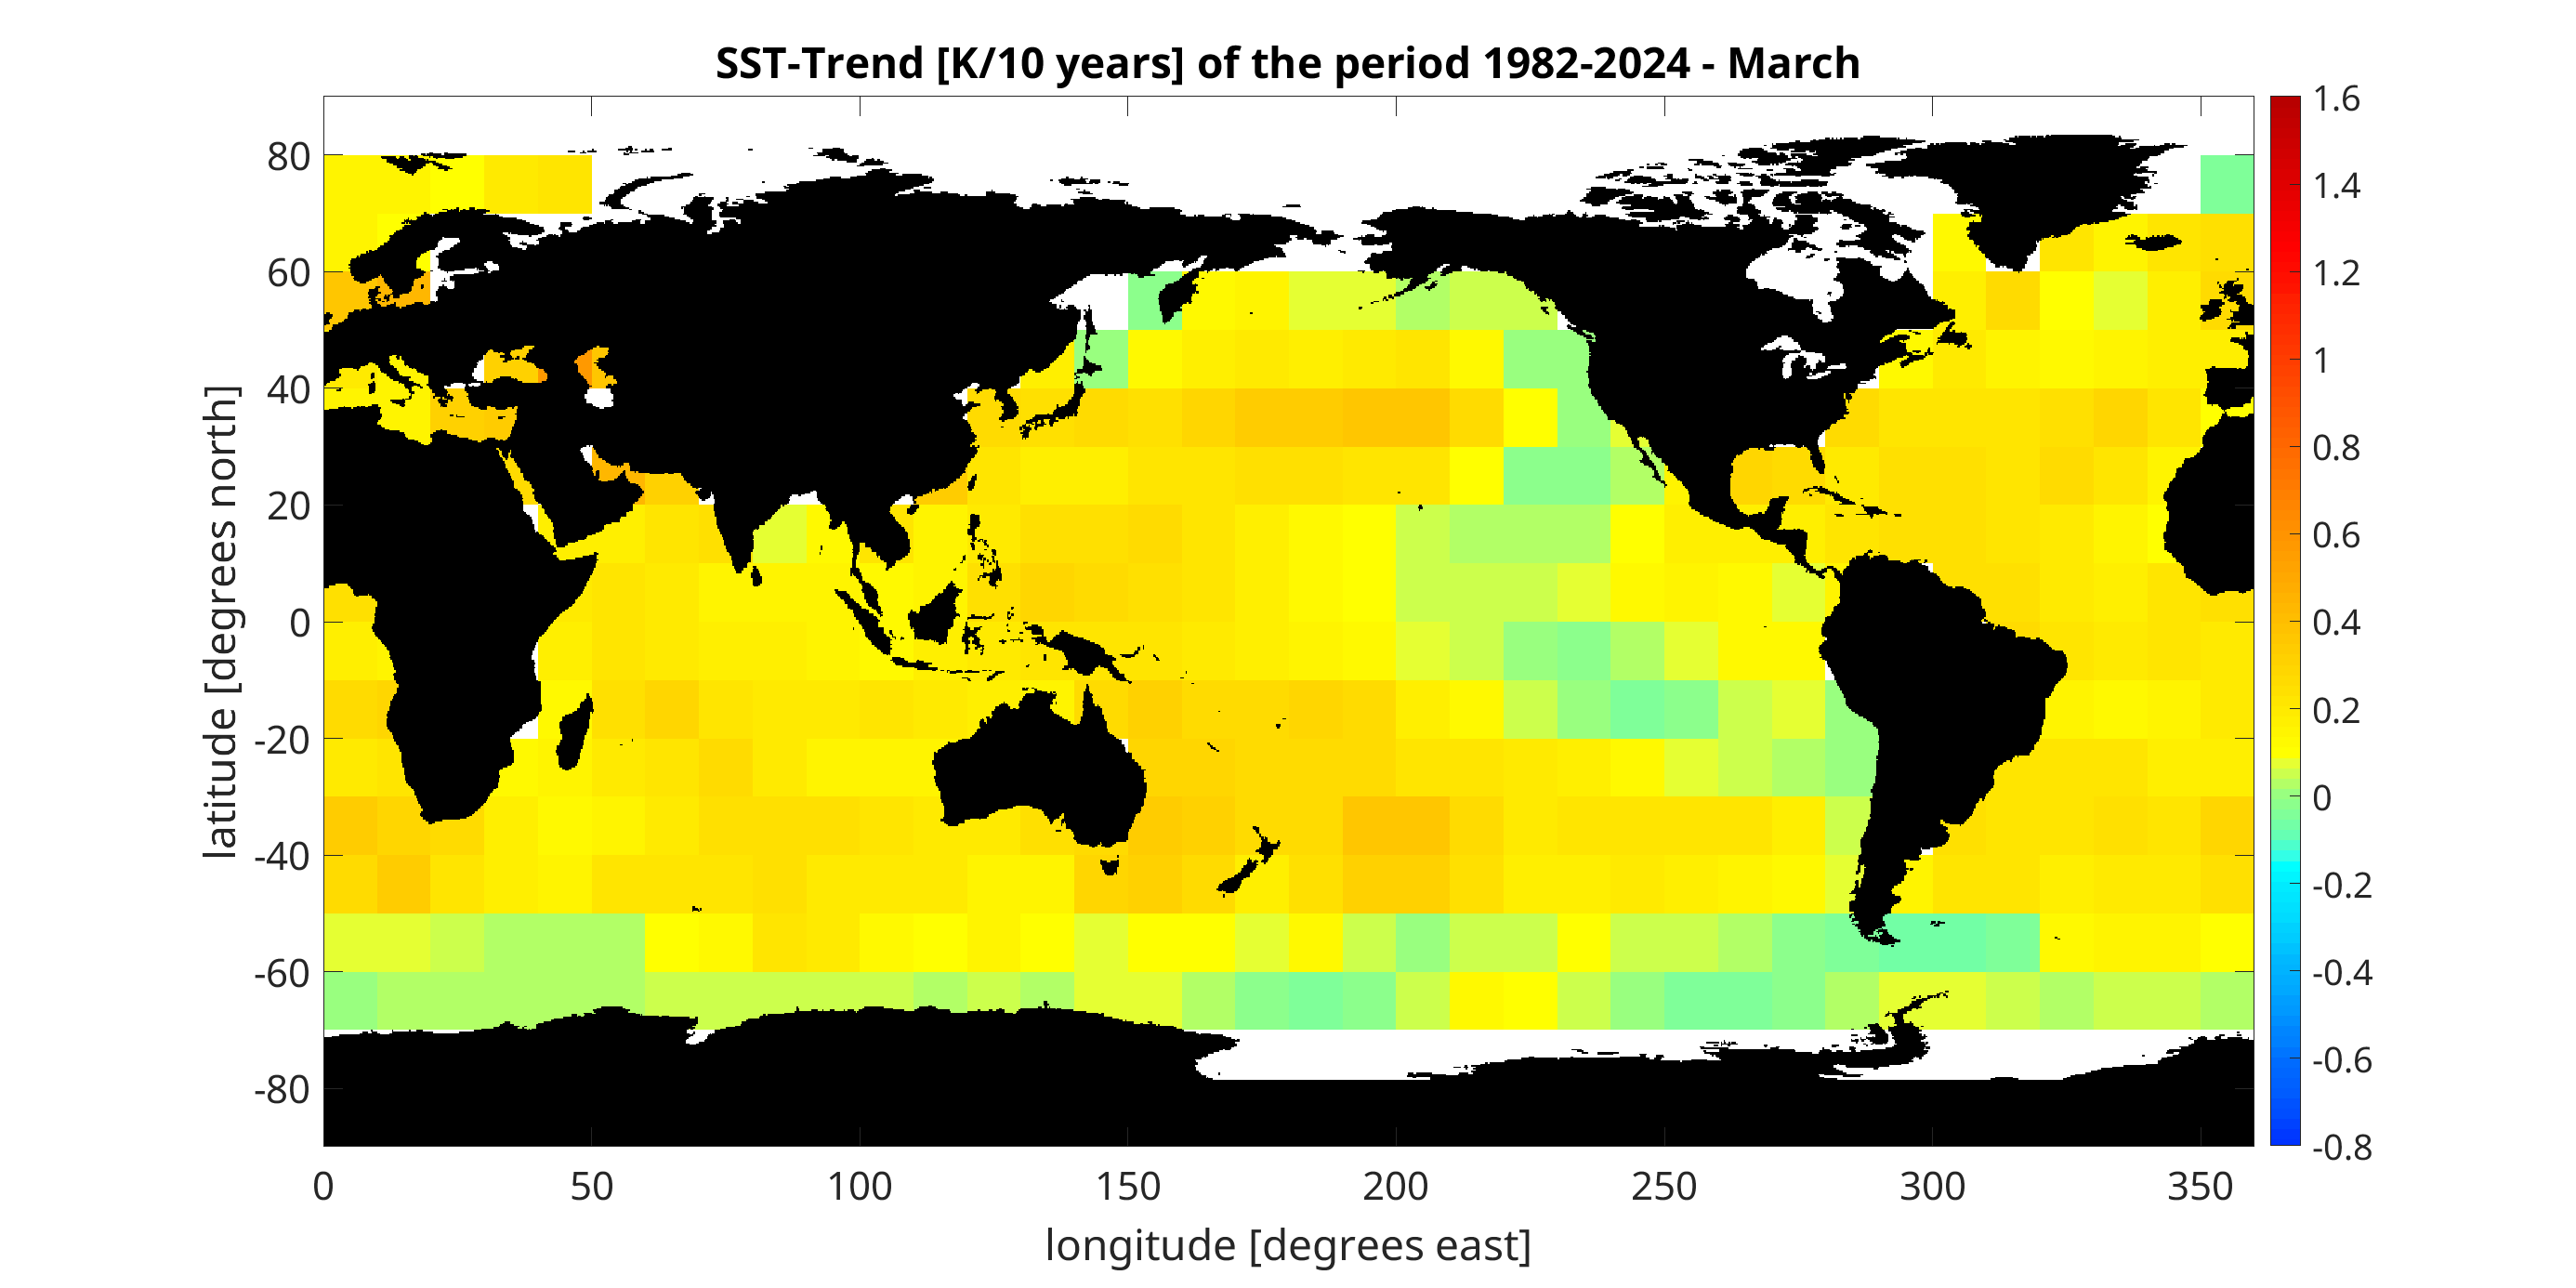
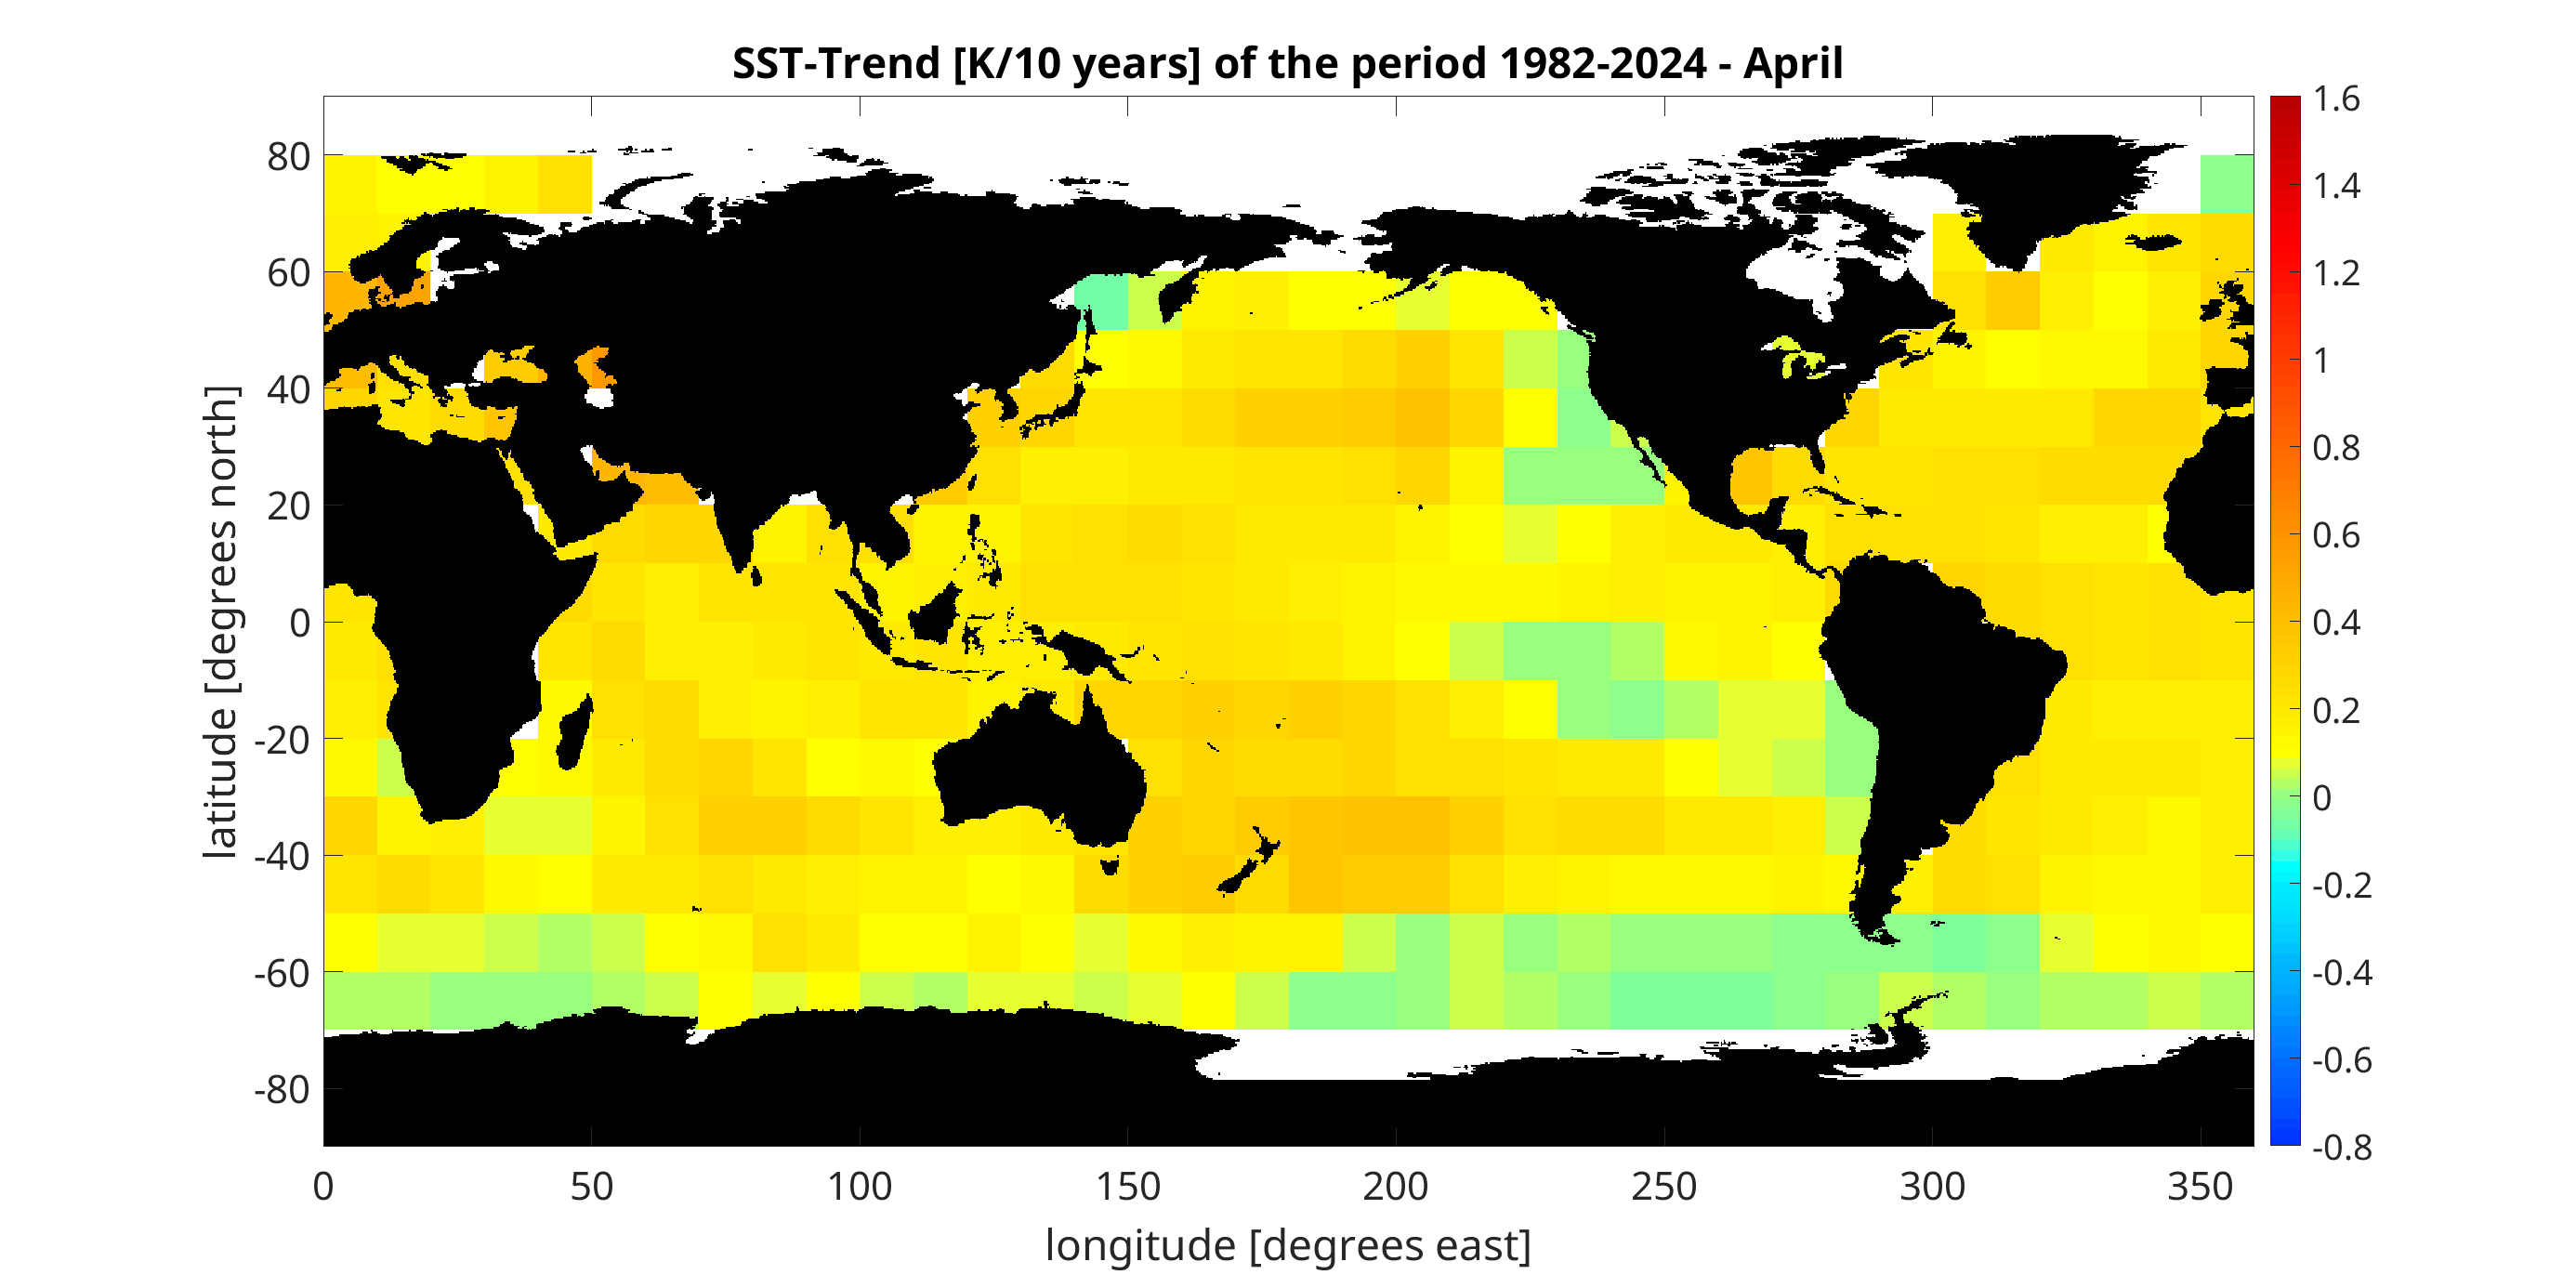
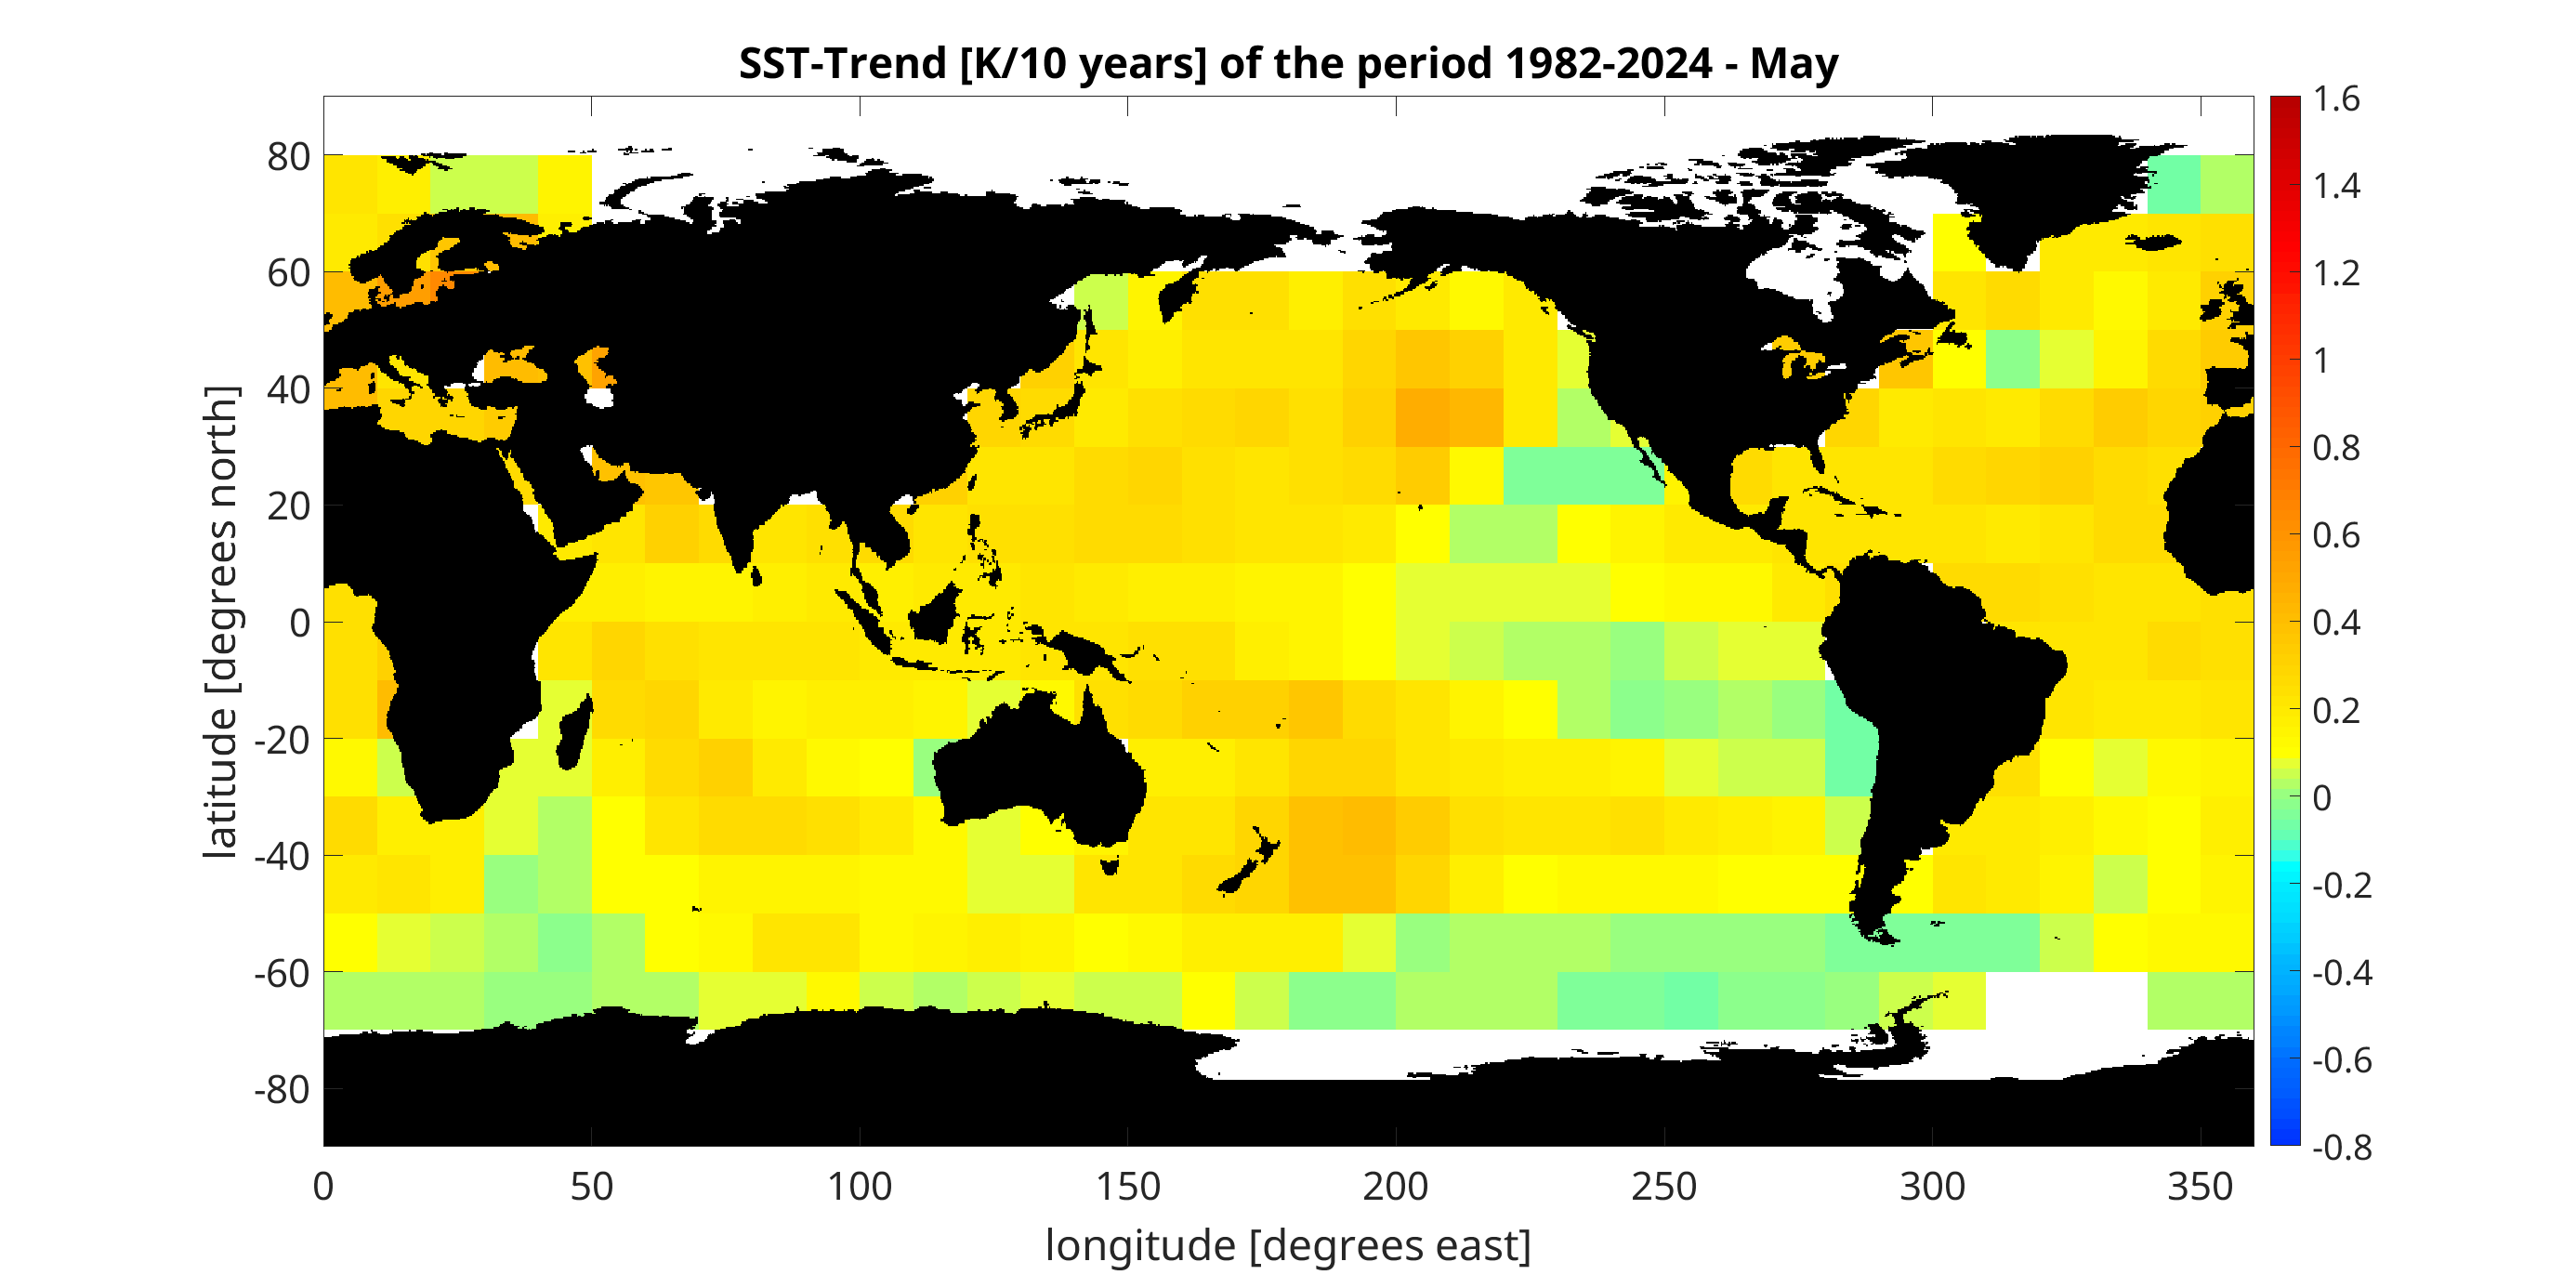
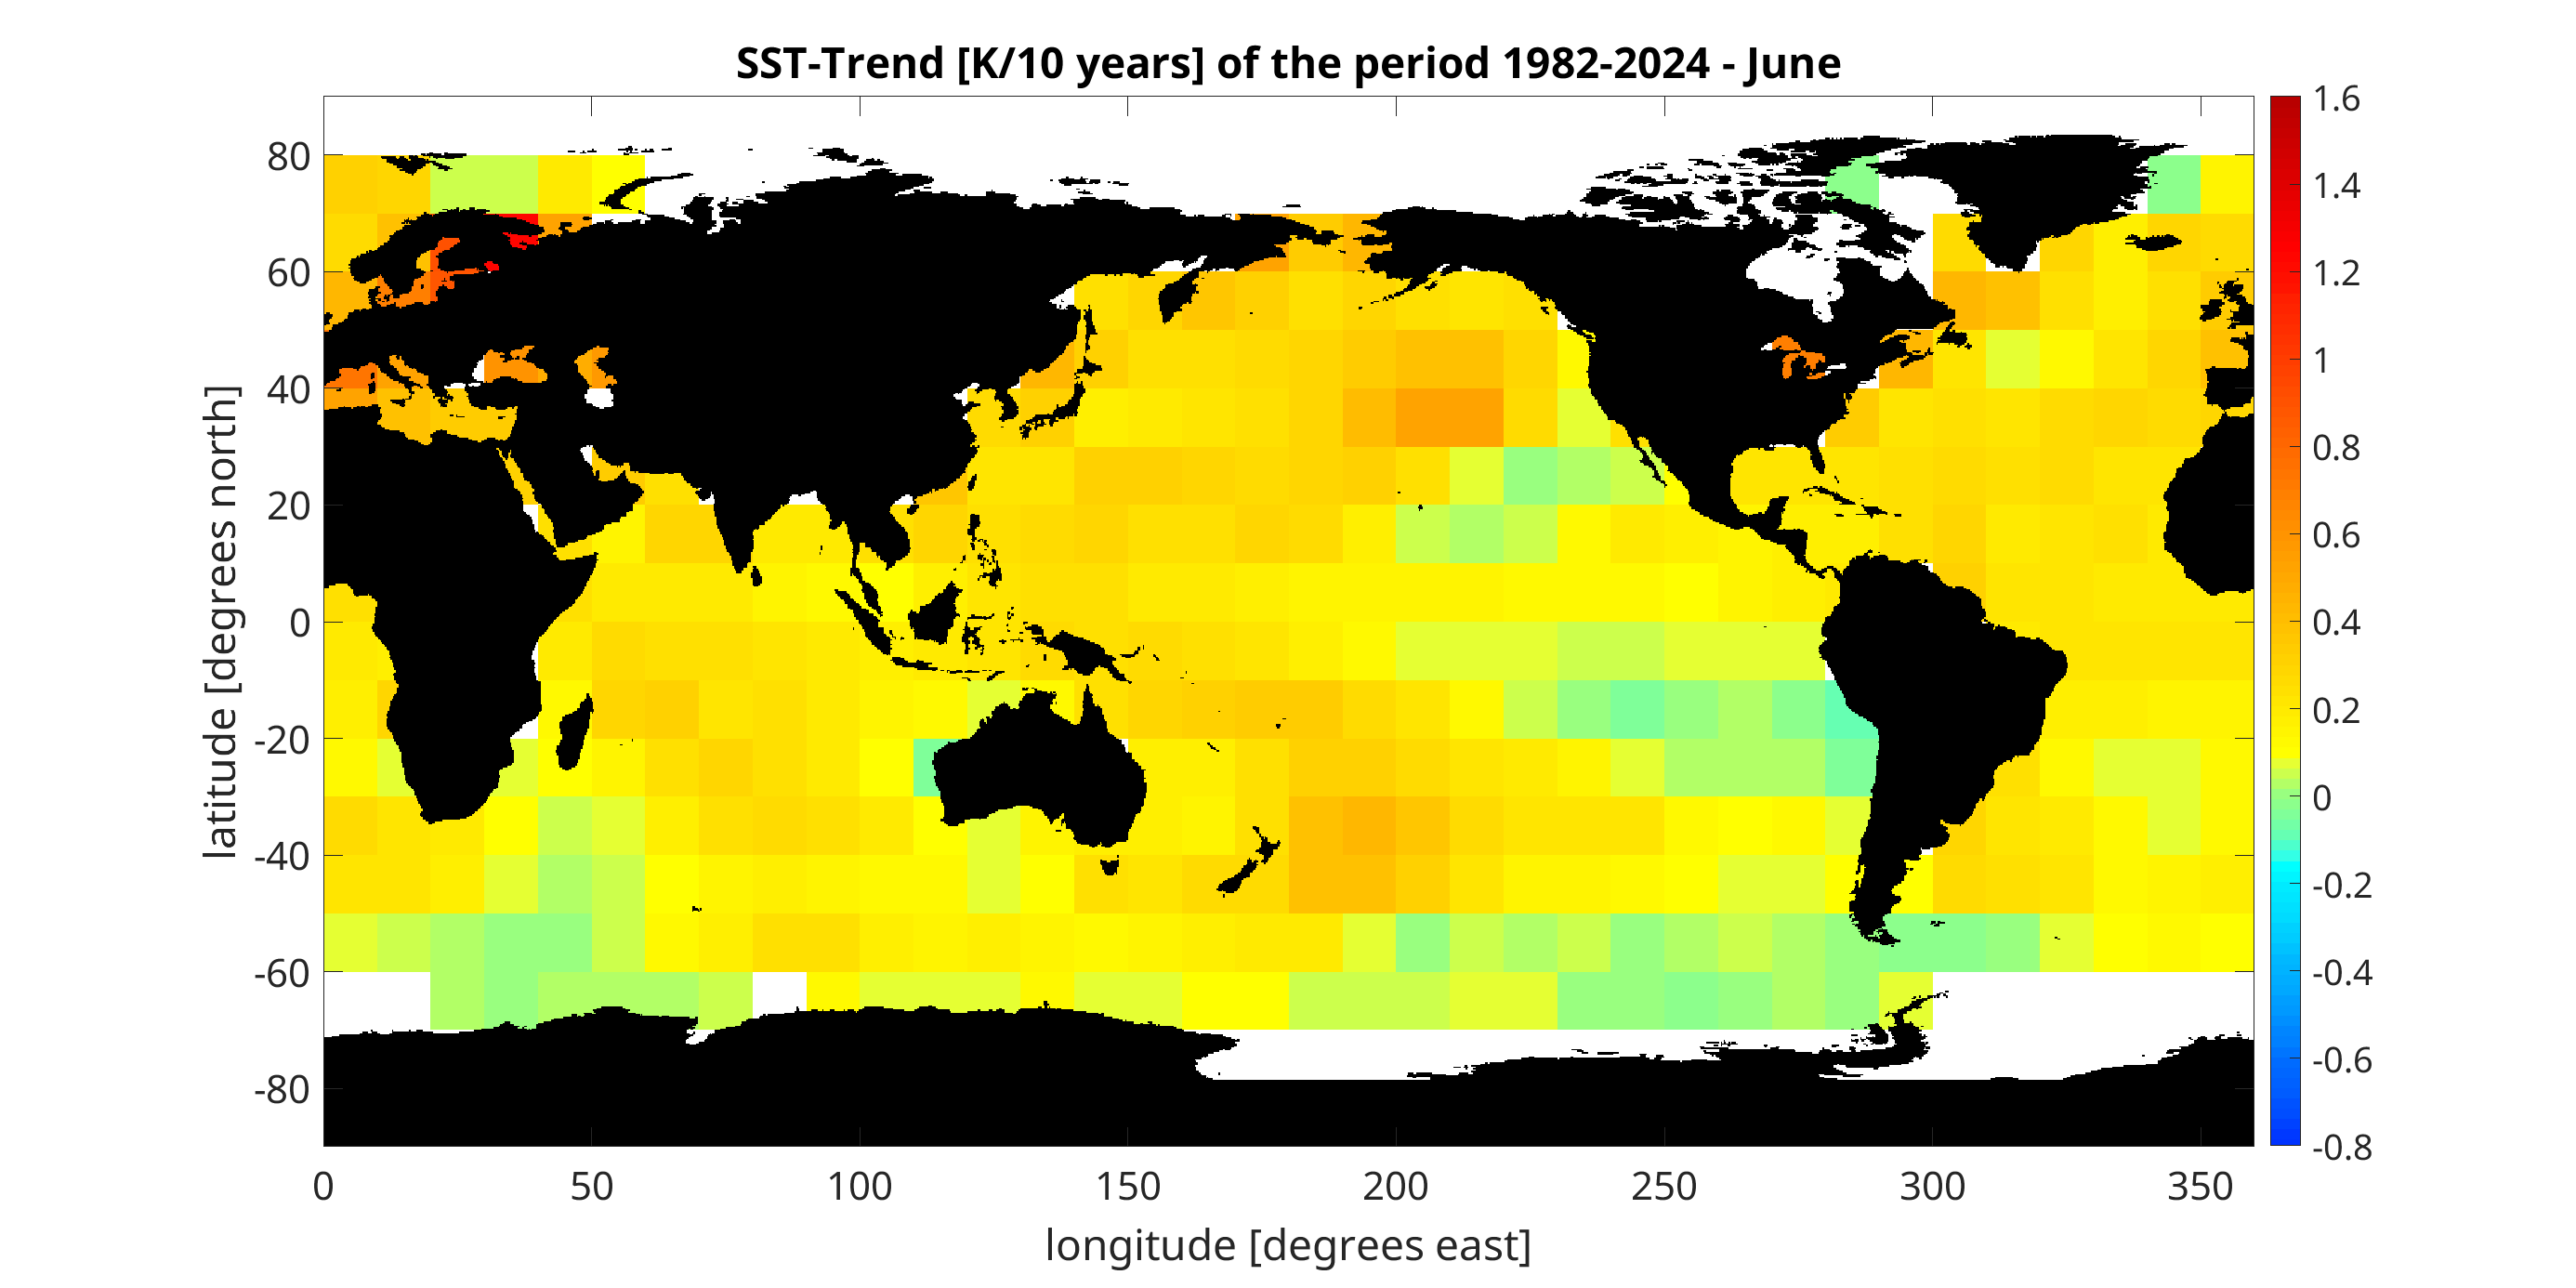
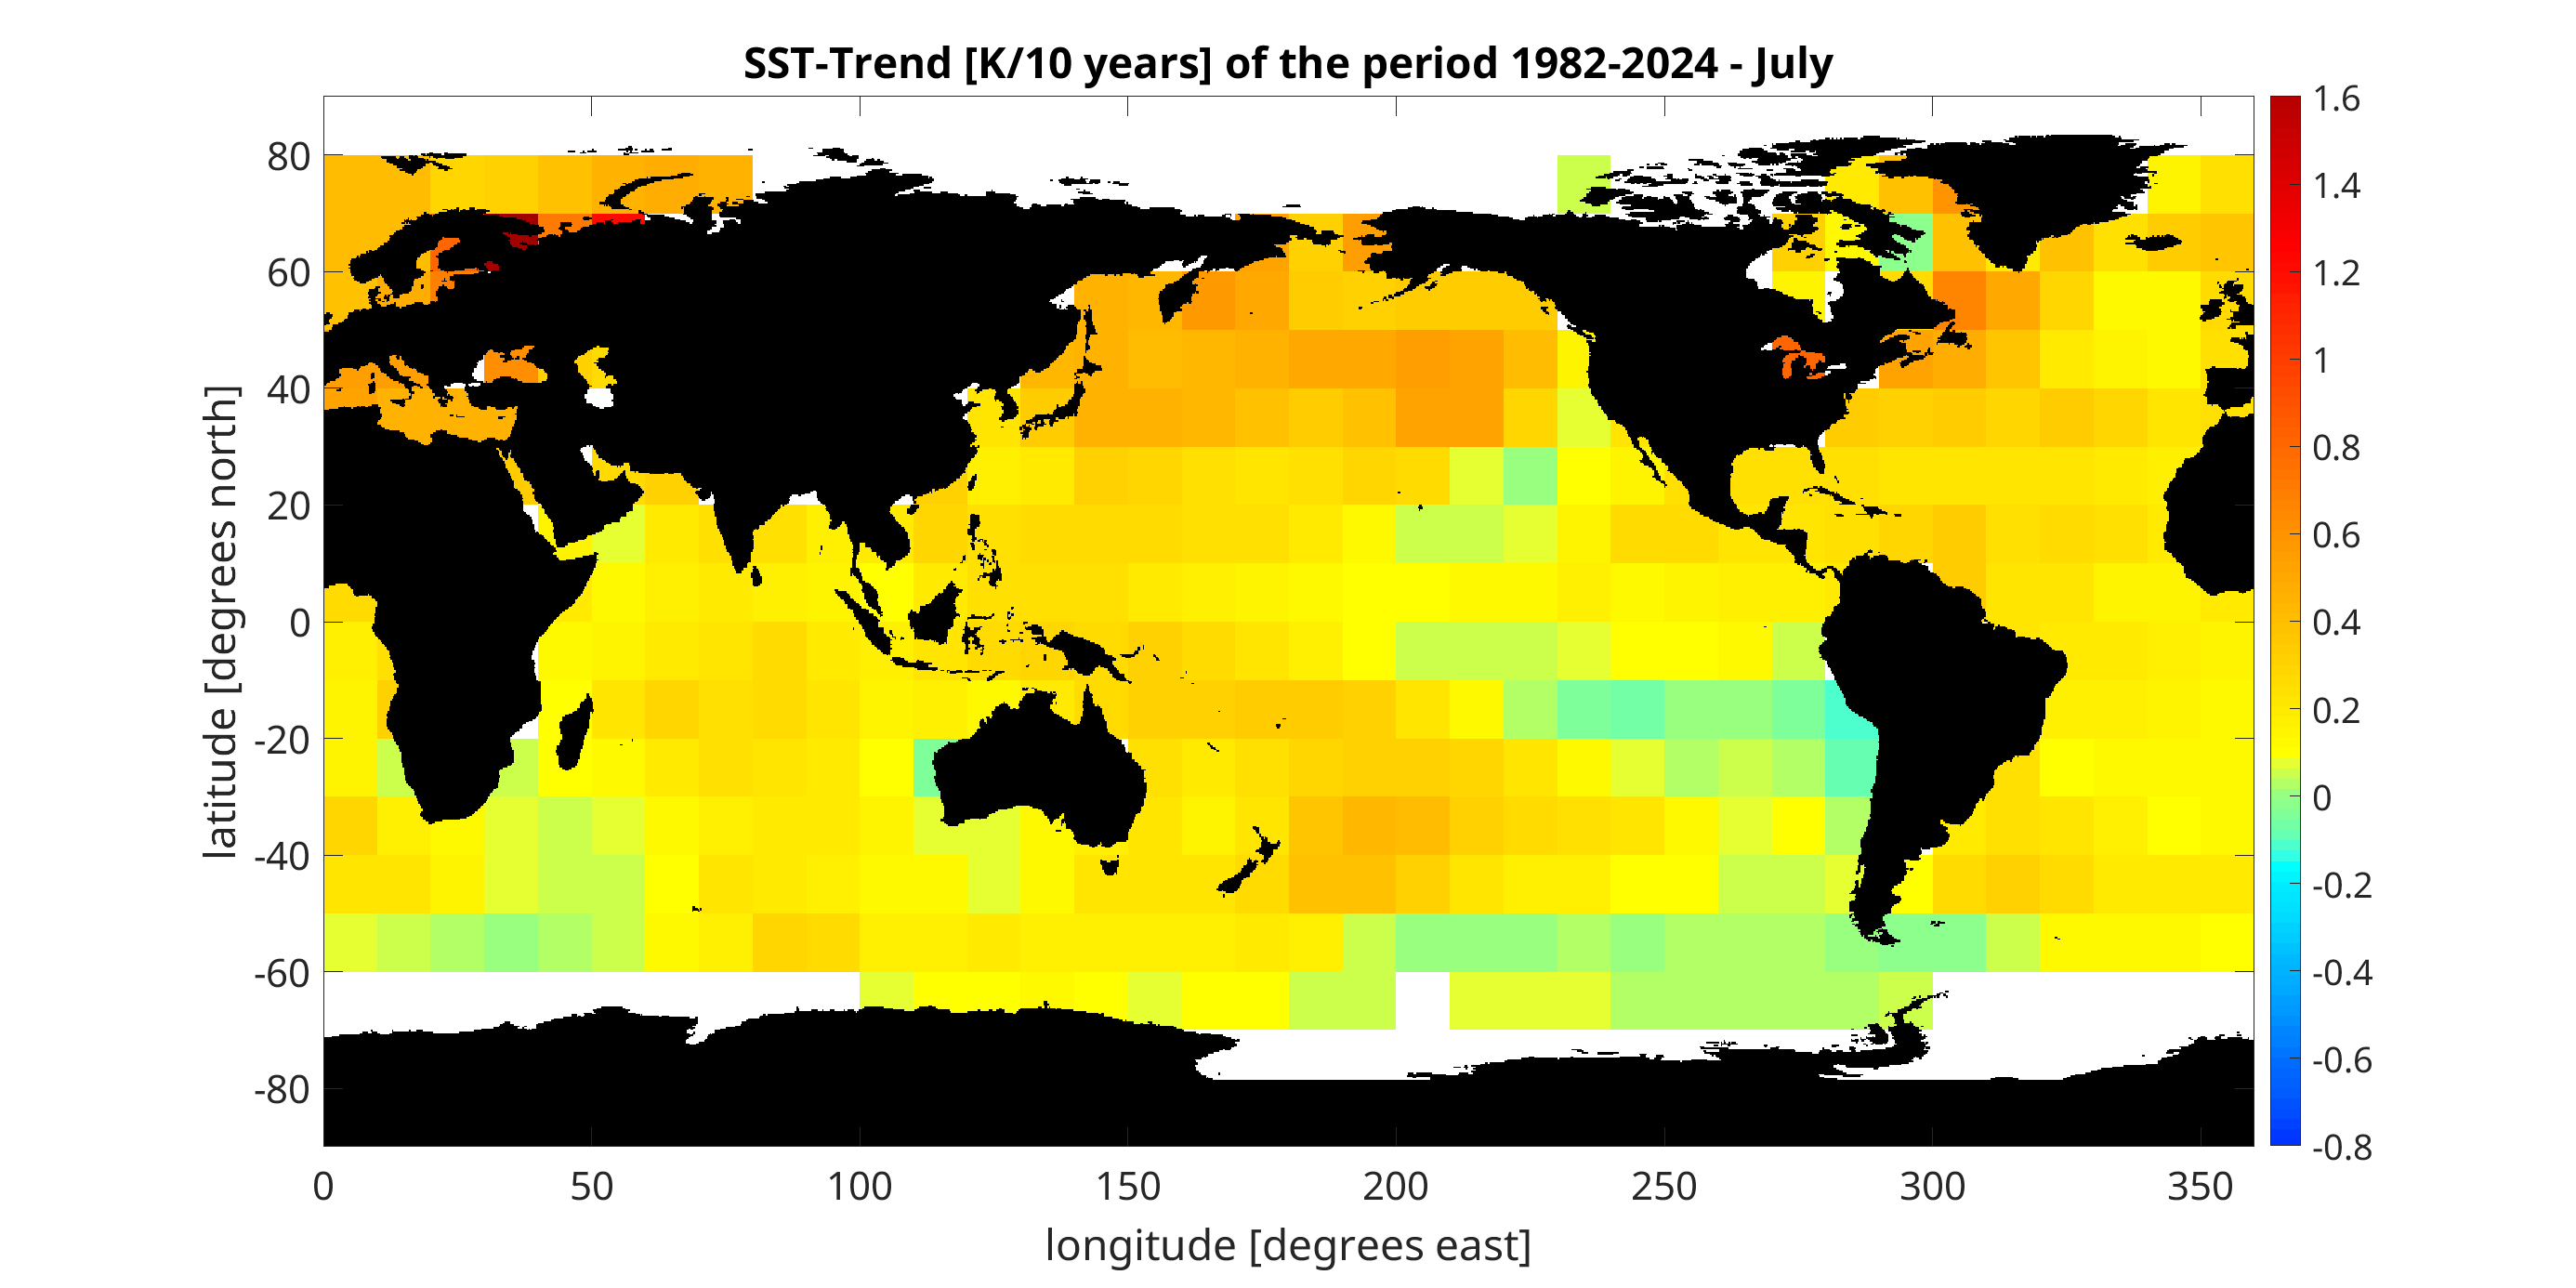
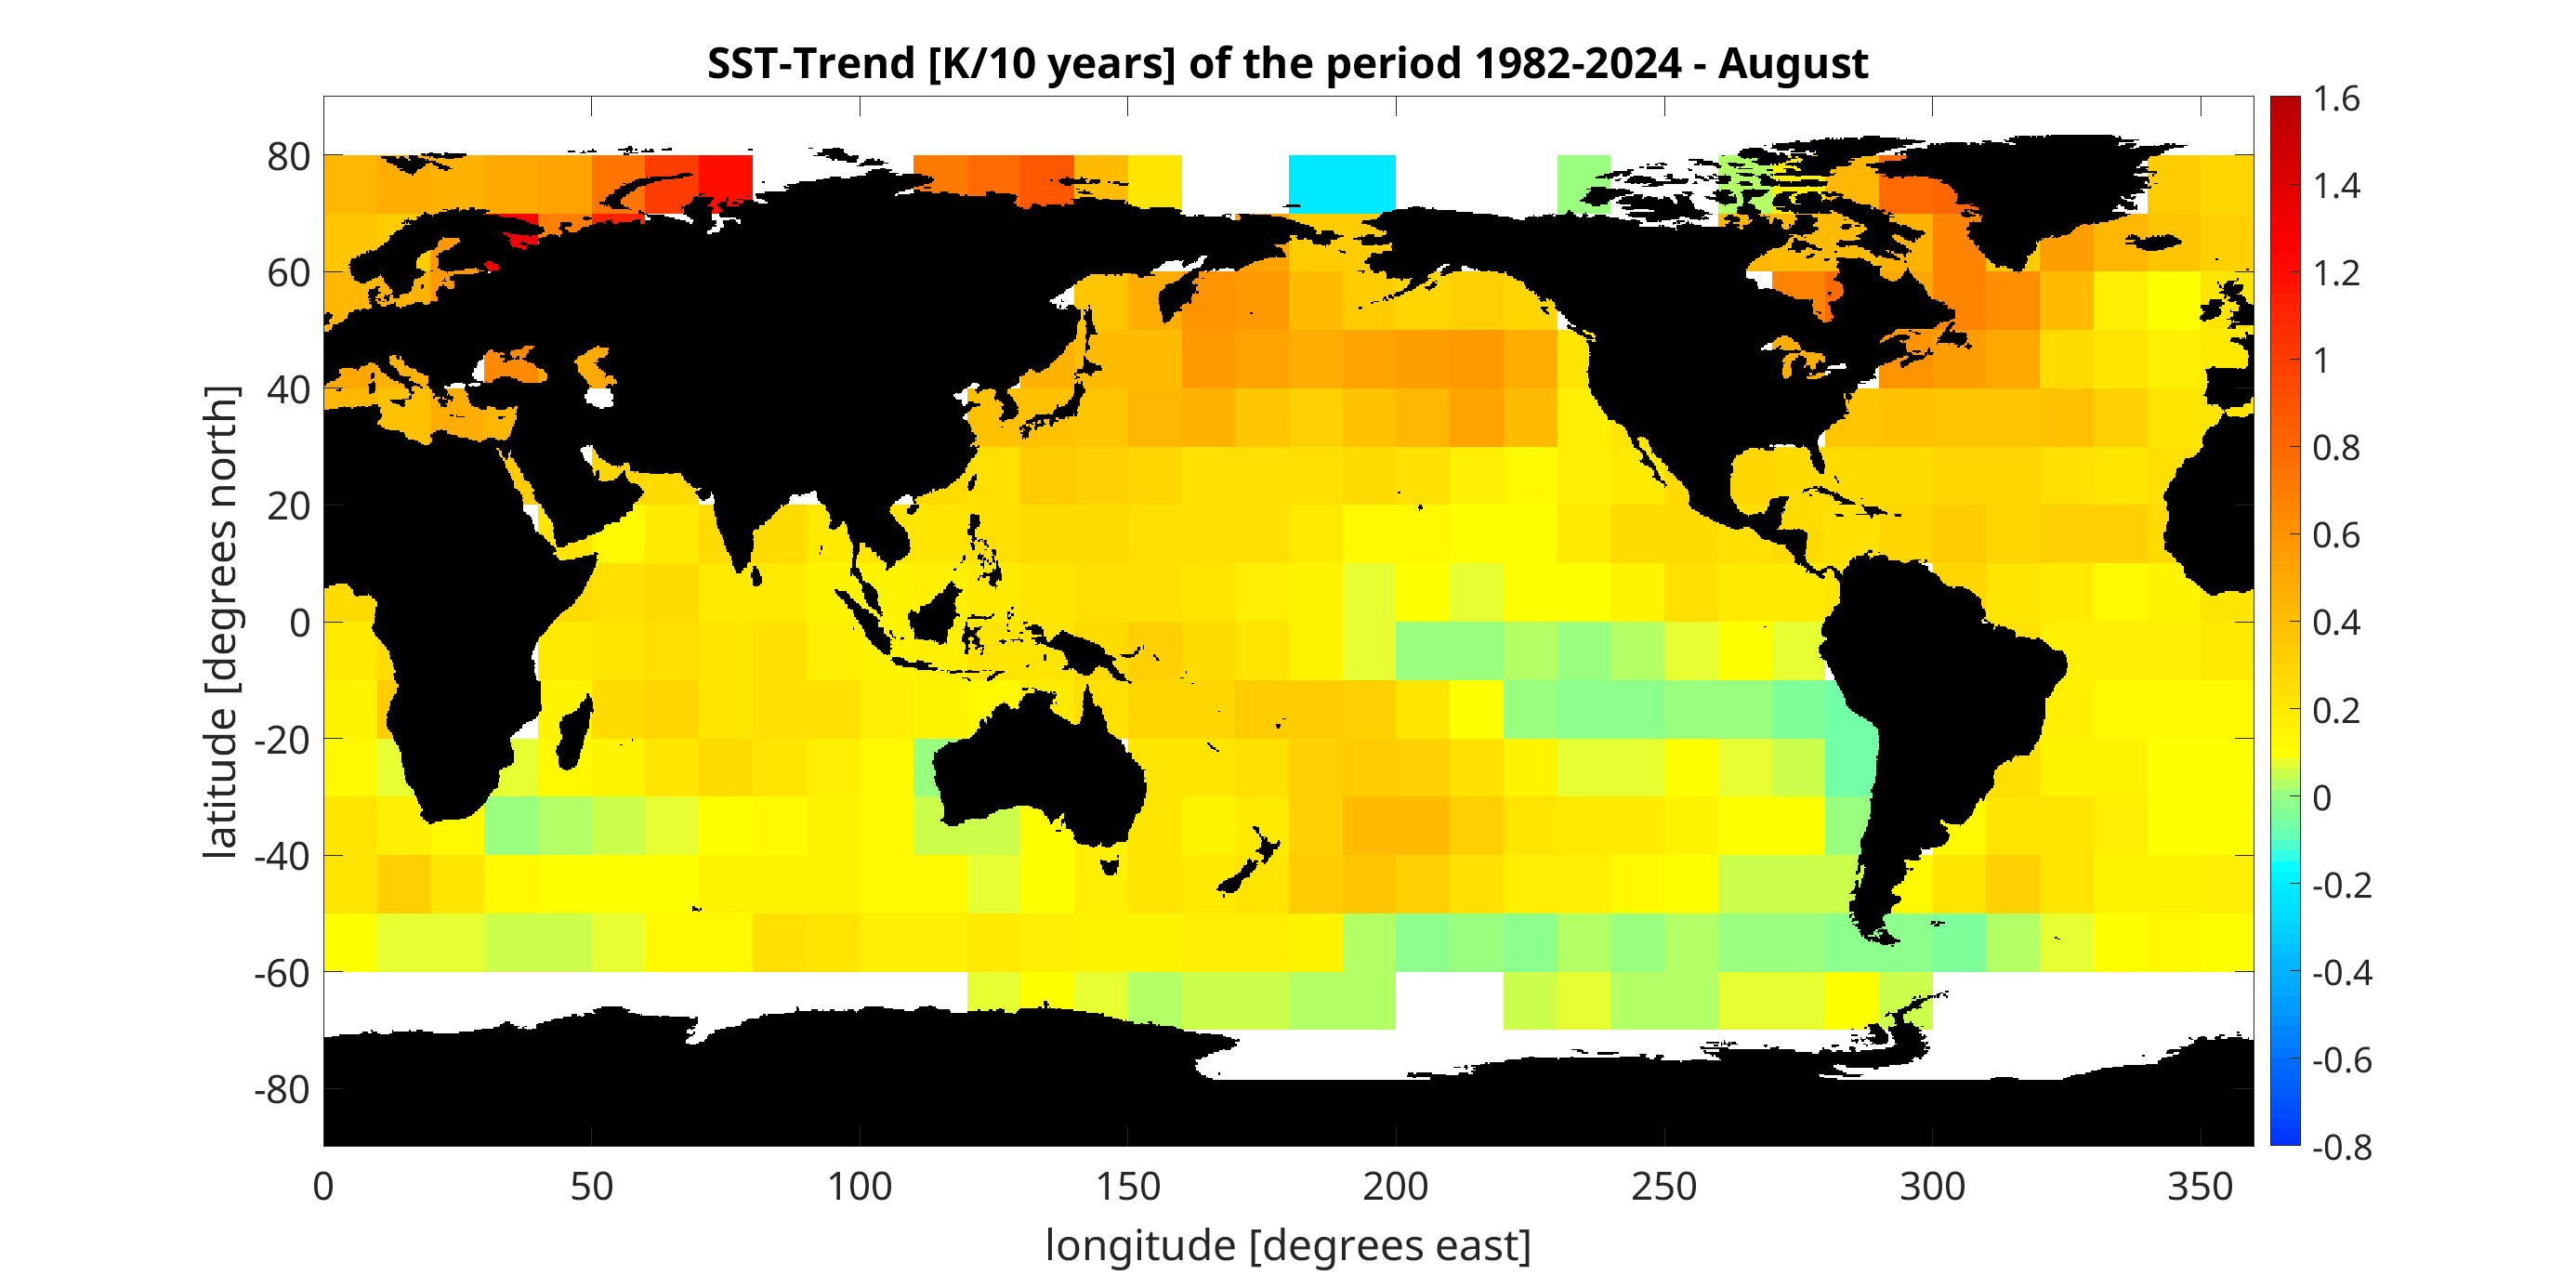
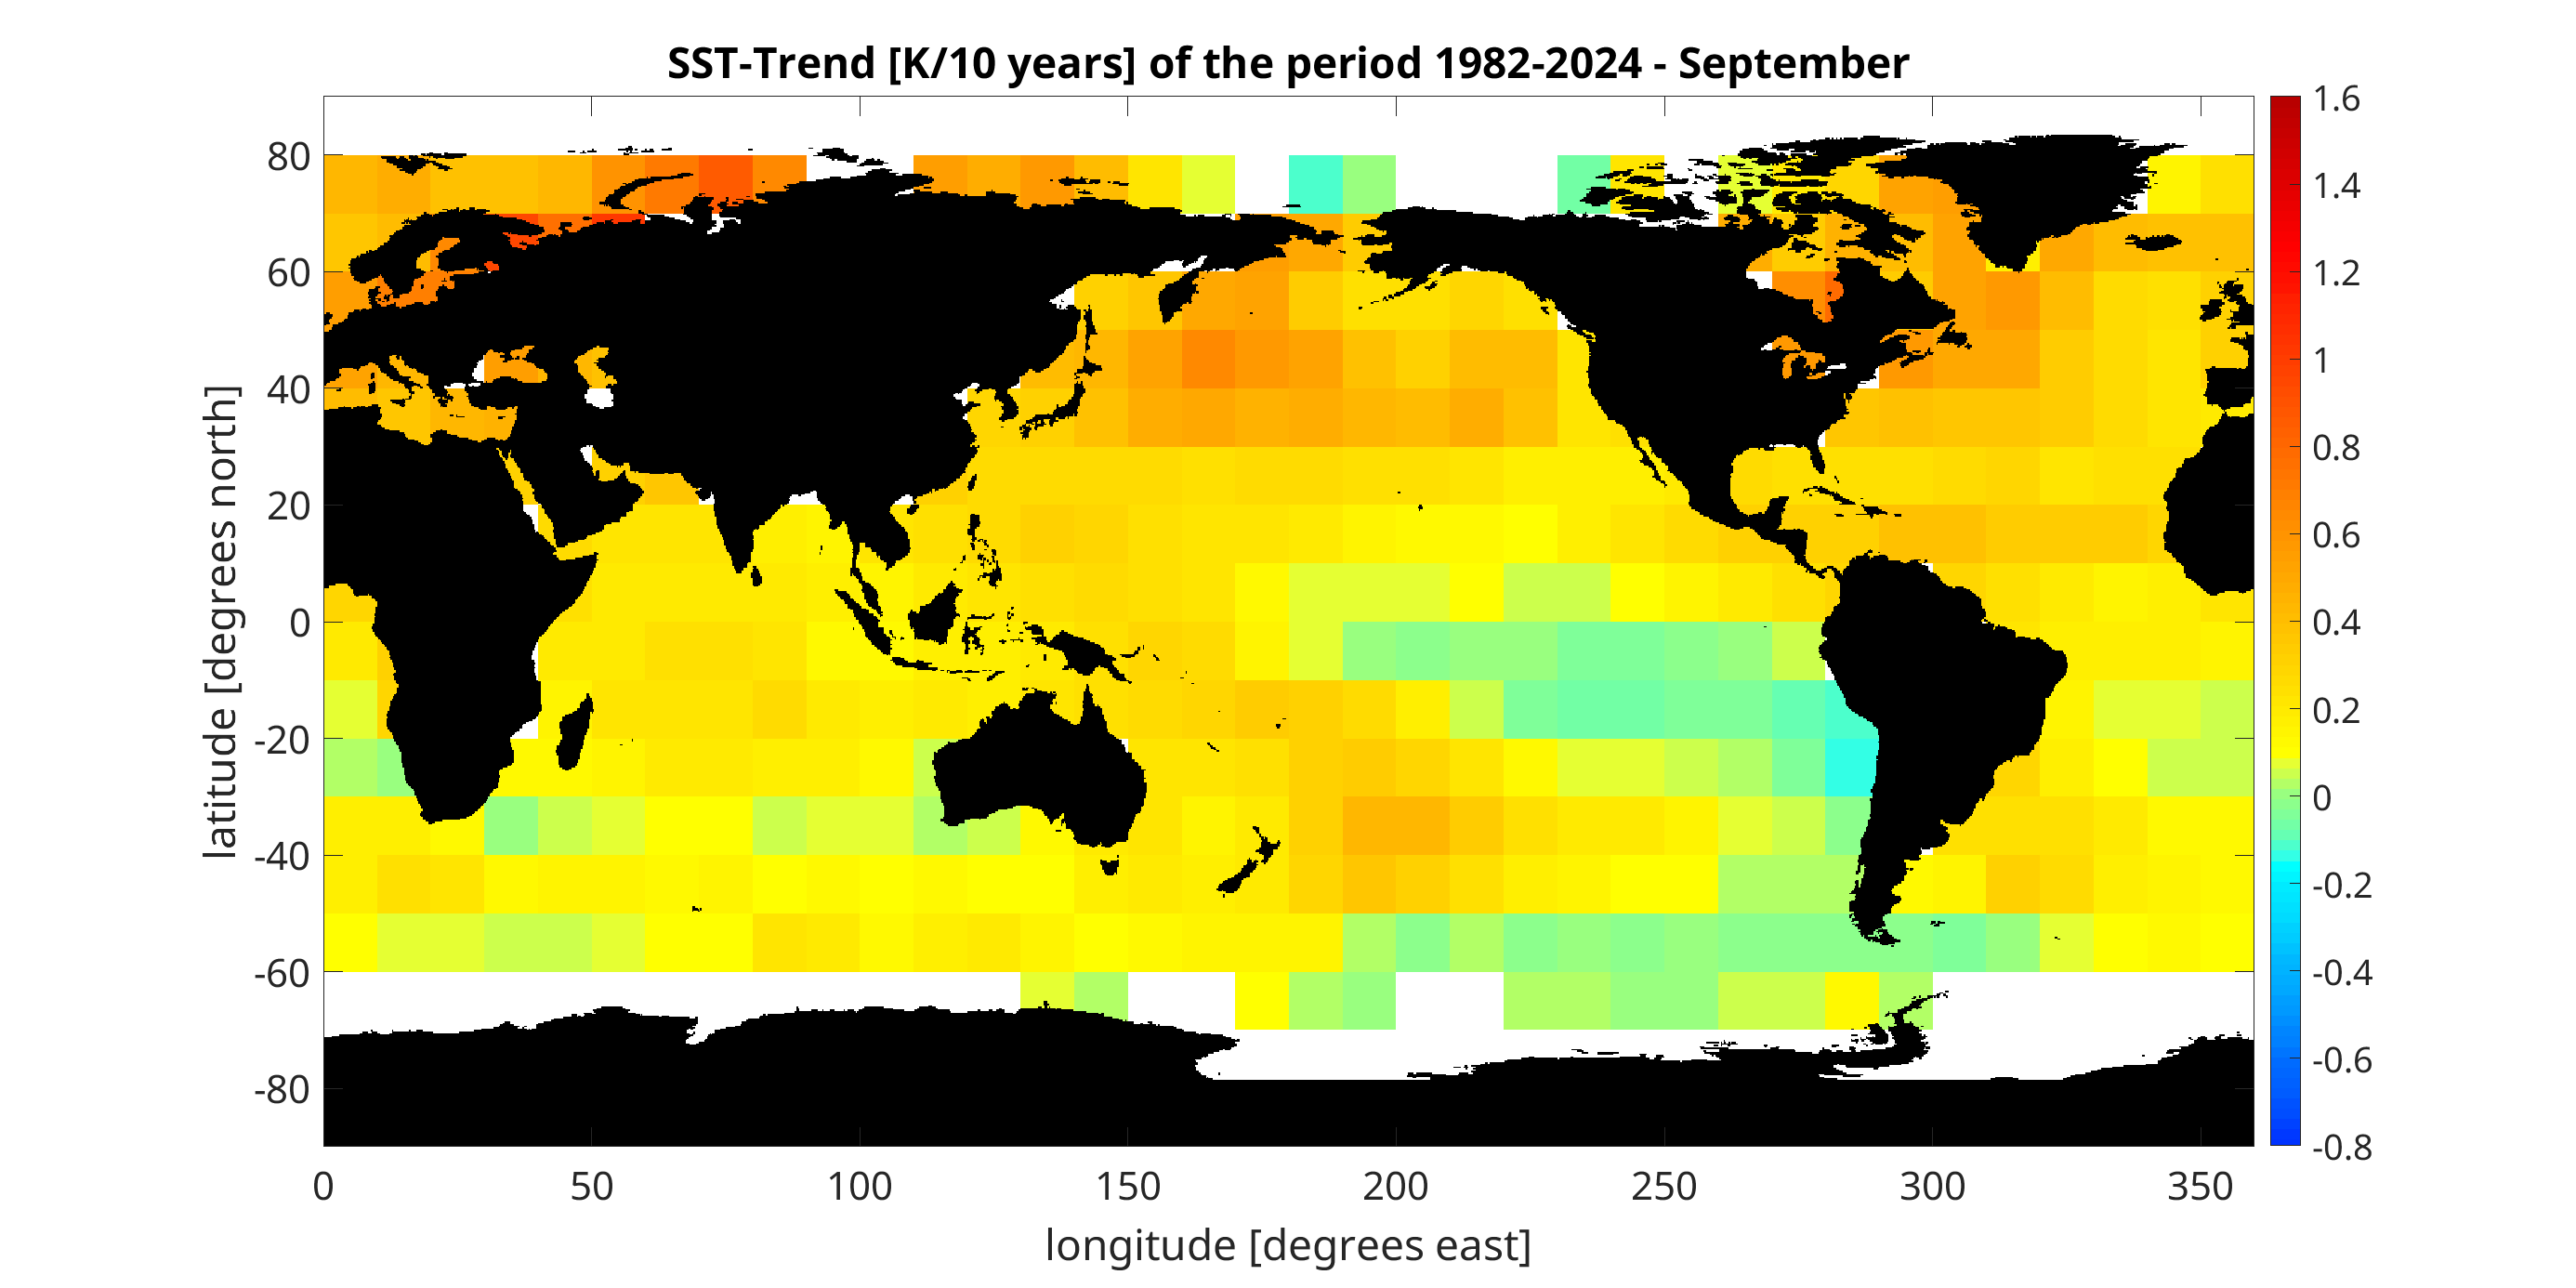
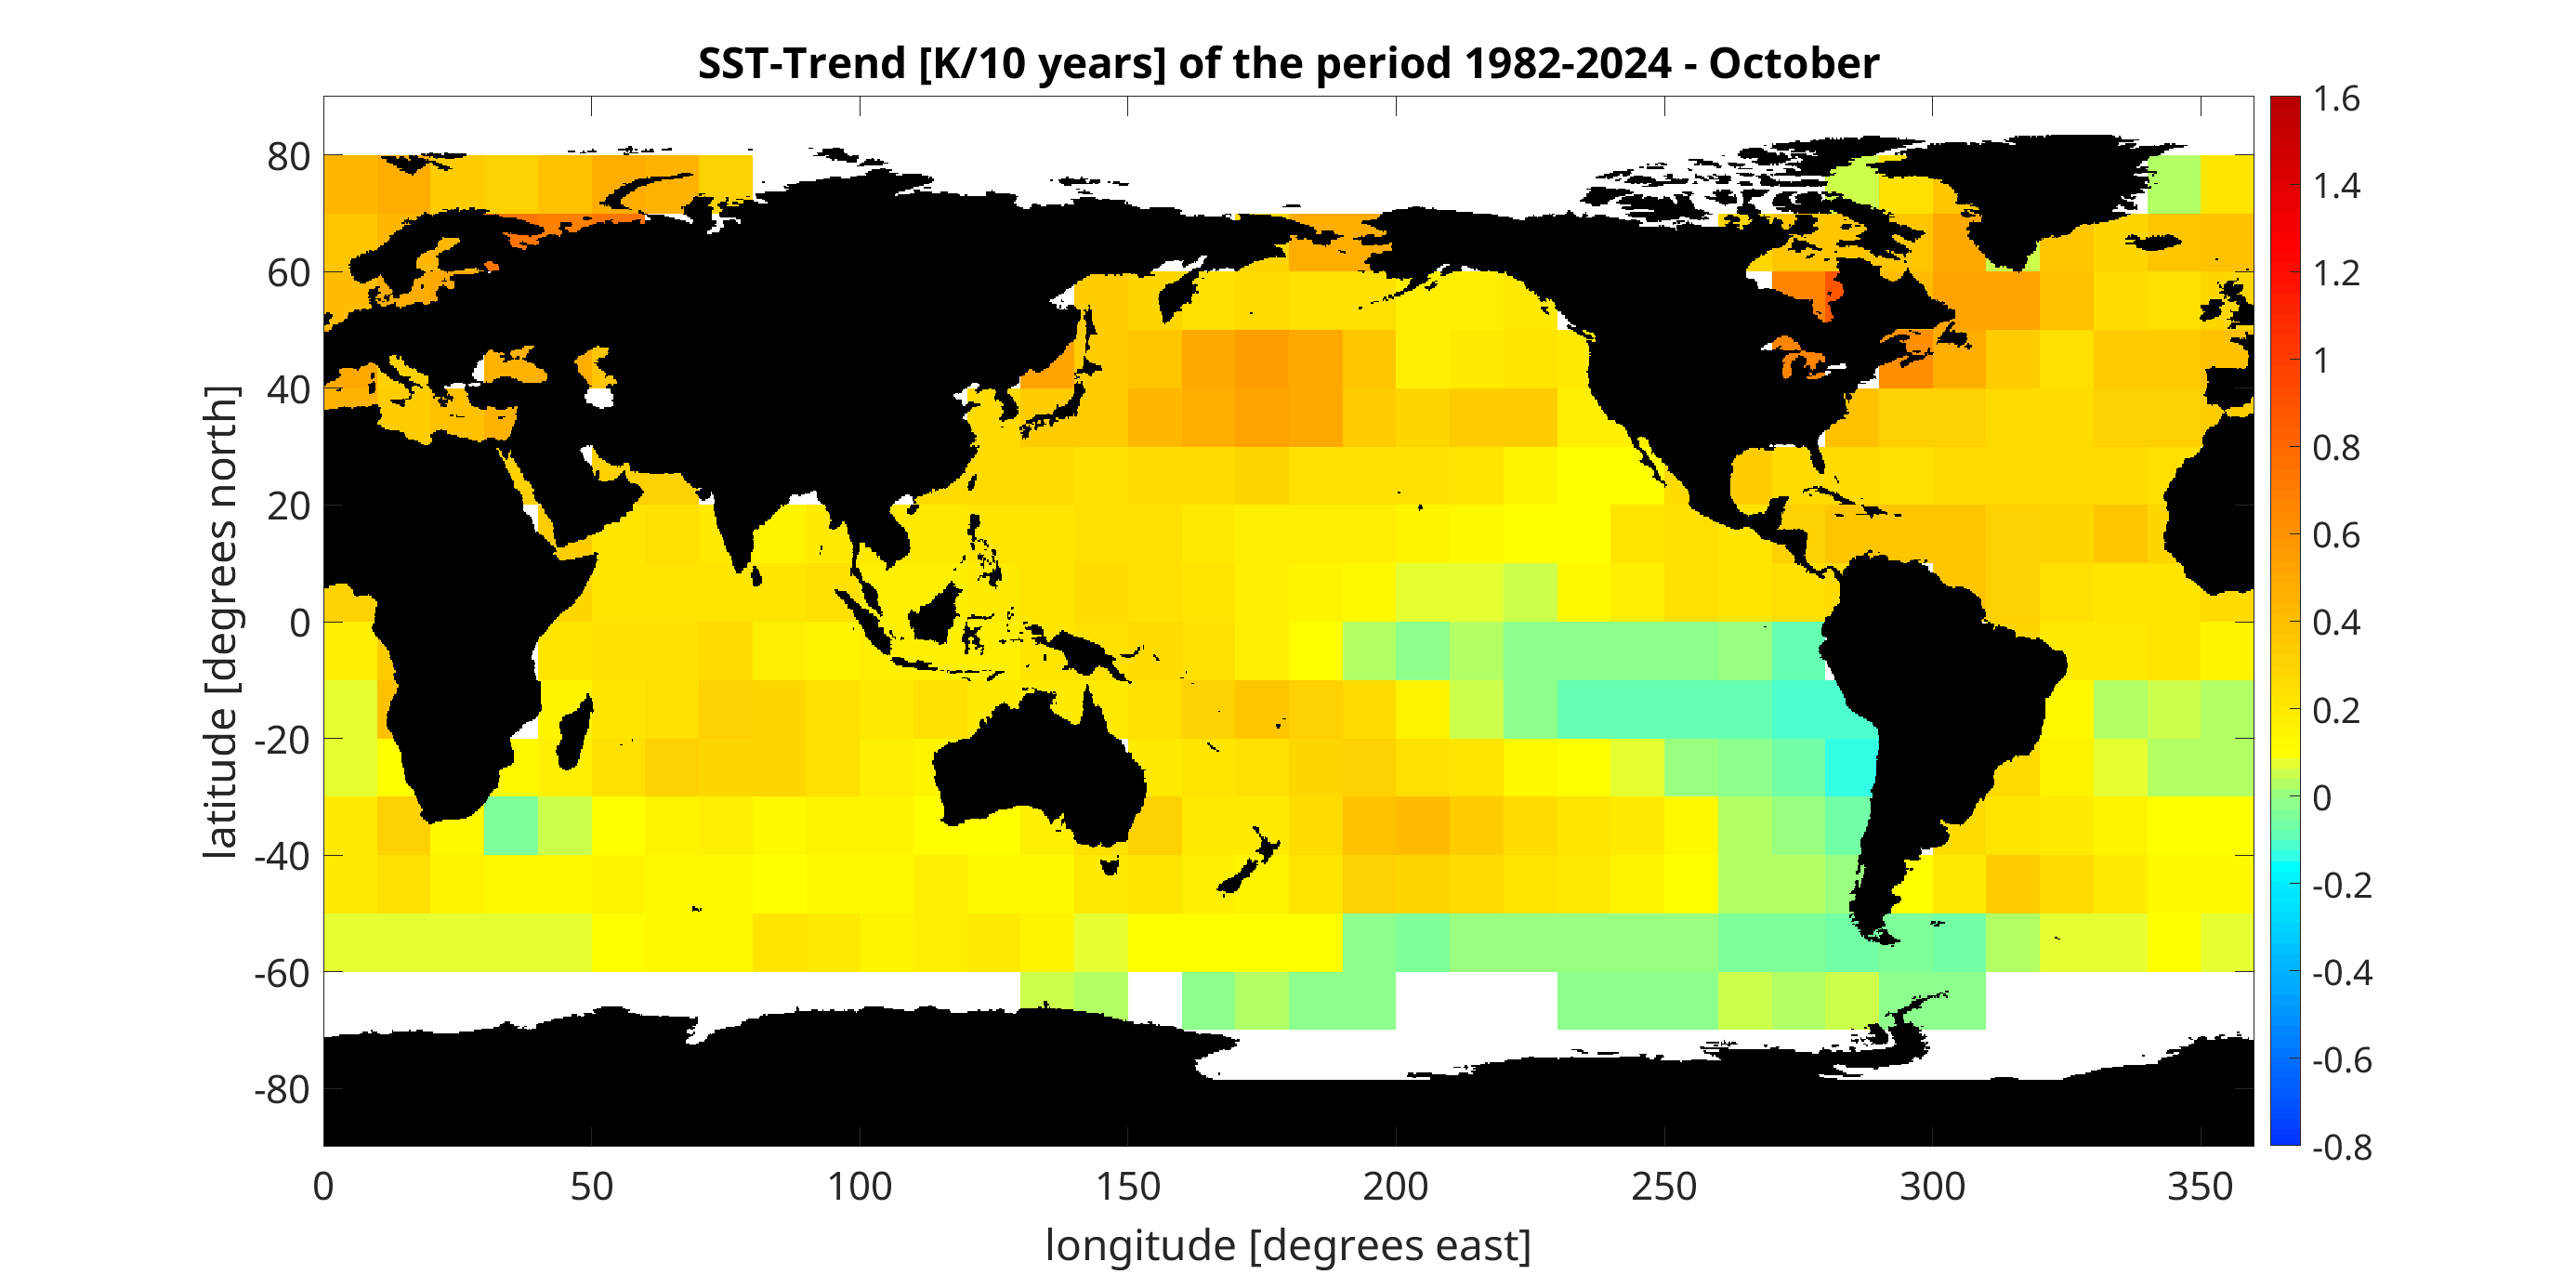
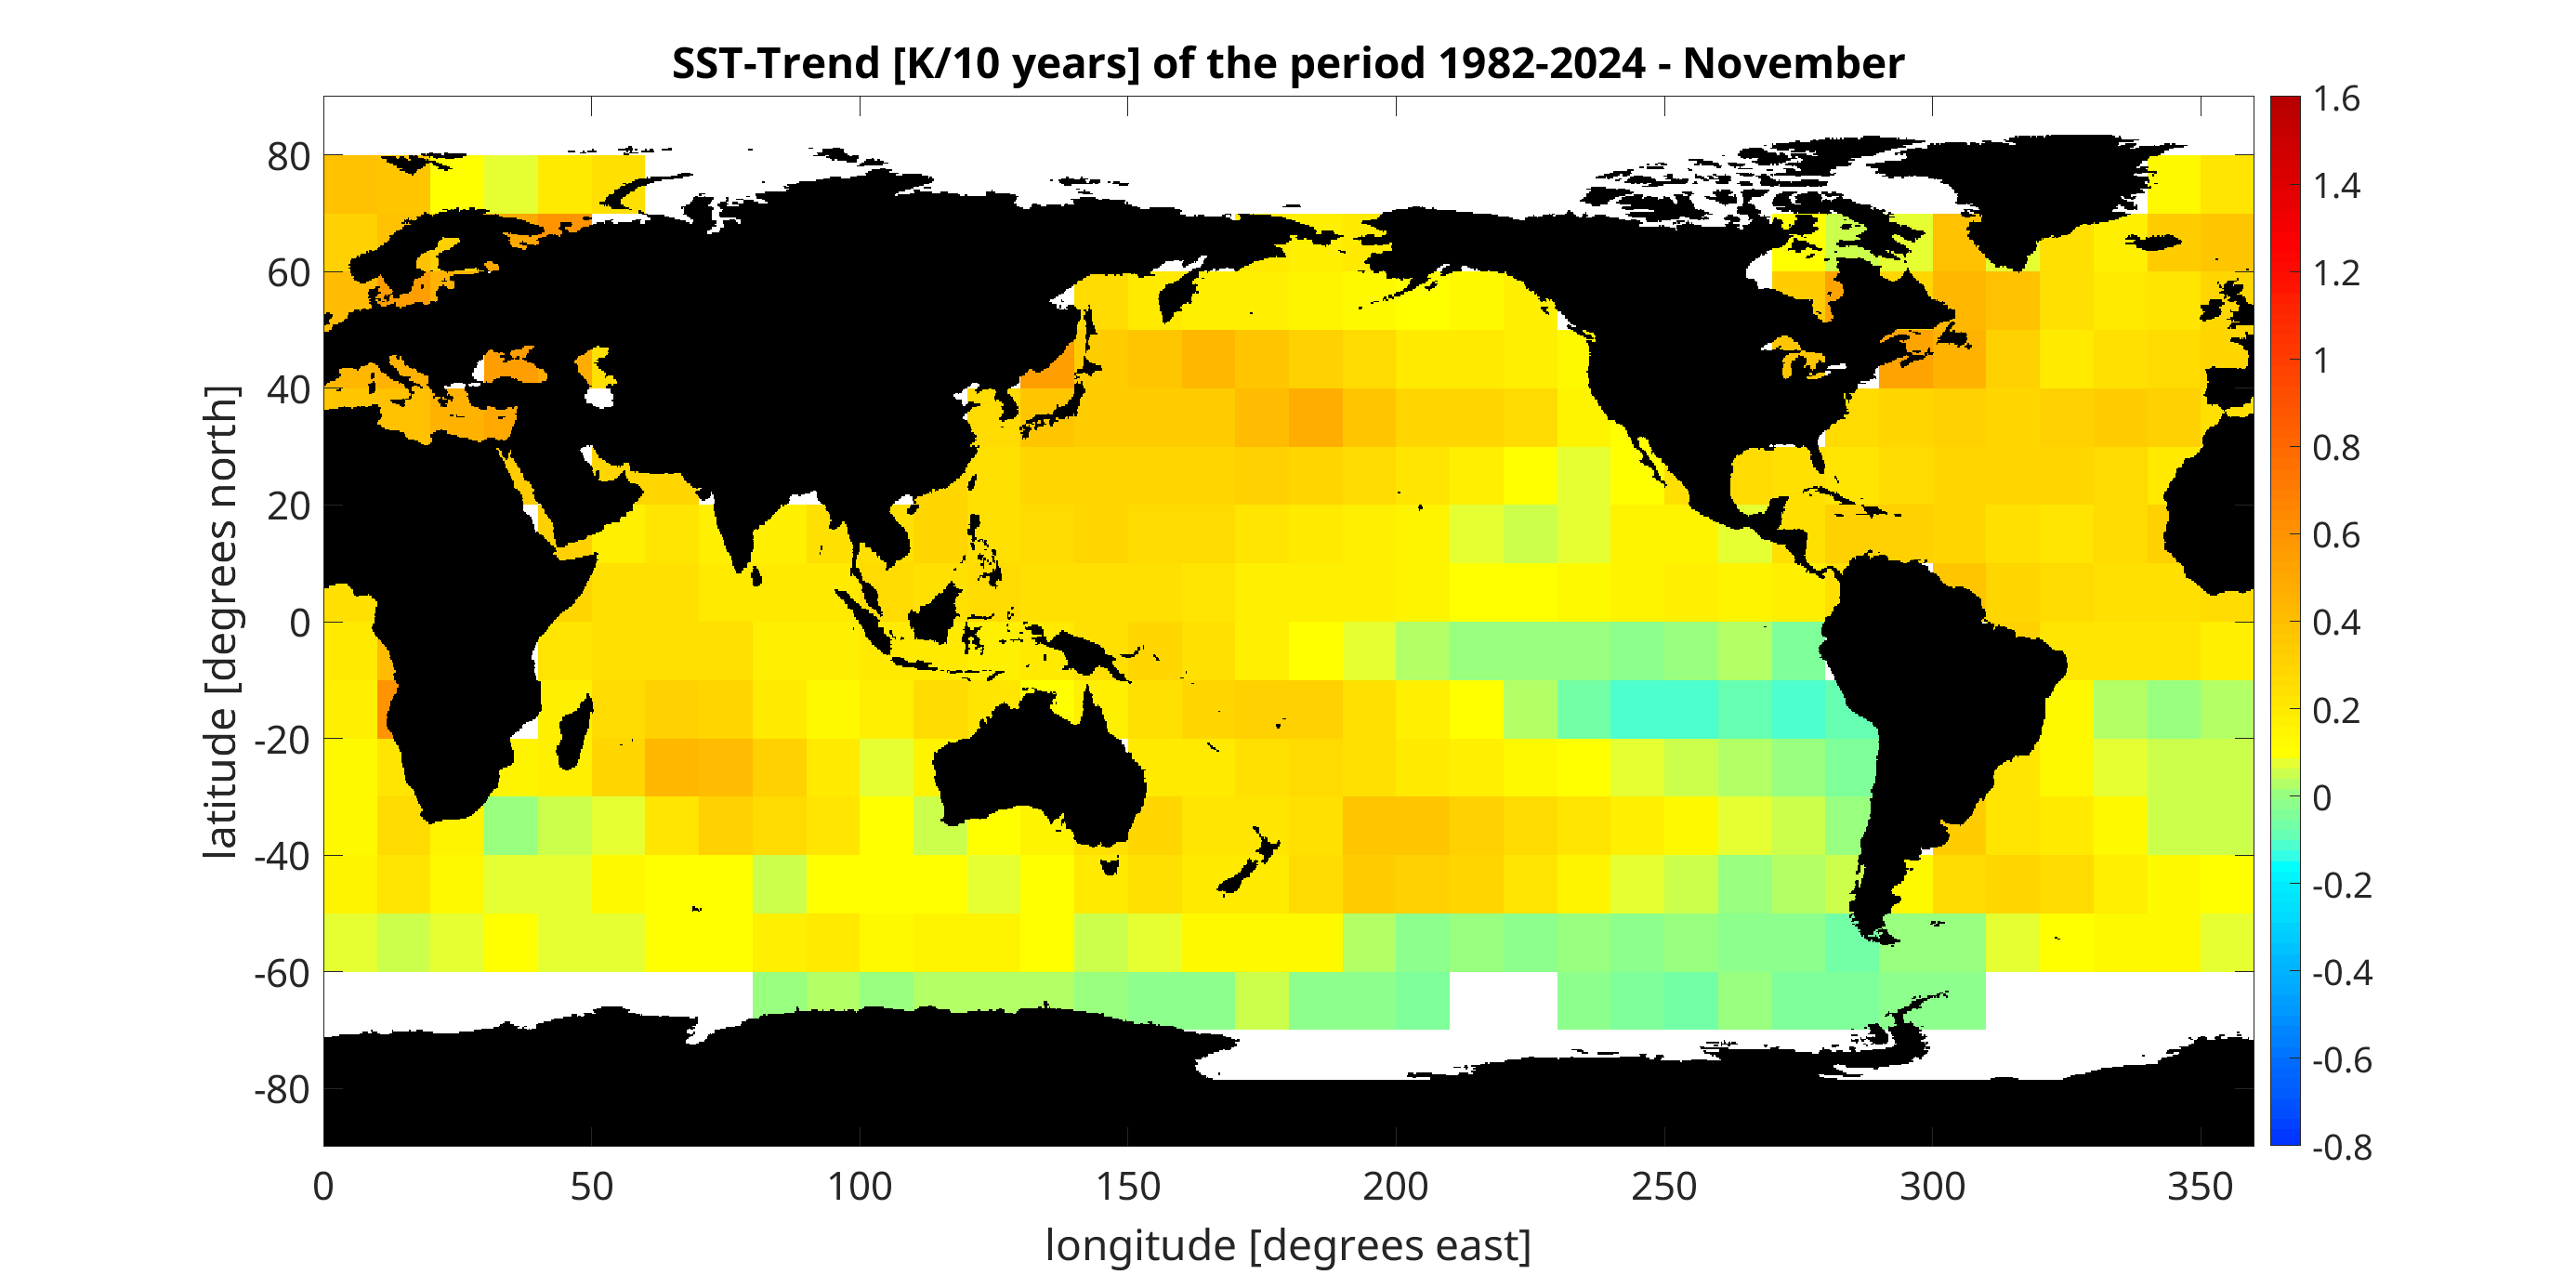
Graphs of the SST trend computed from 13-month moving average SST of 10° x 10° boxes. For each of these boxes shown in the sample trend figure at the top right the linear trend, its significance (p-value) and the mean SST are computed (by M. Meyer). Trend values without a p-value are not significant.
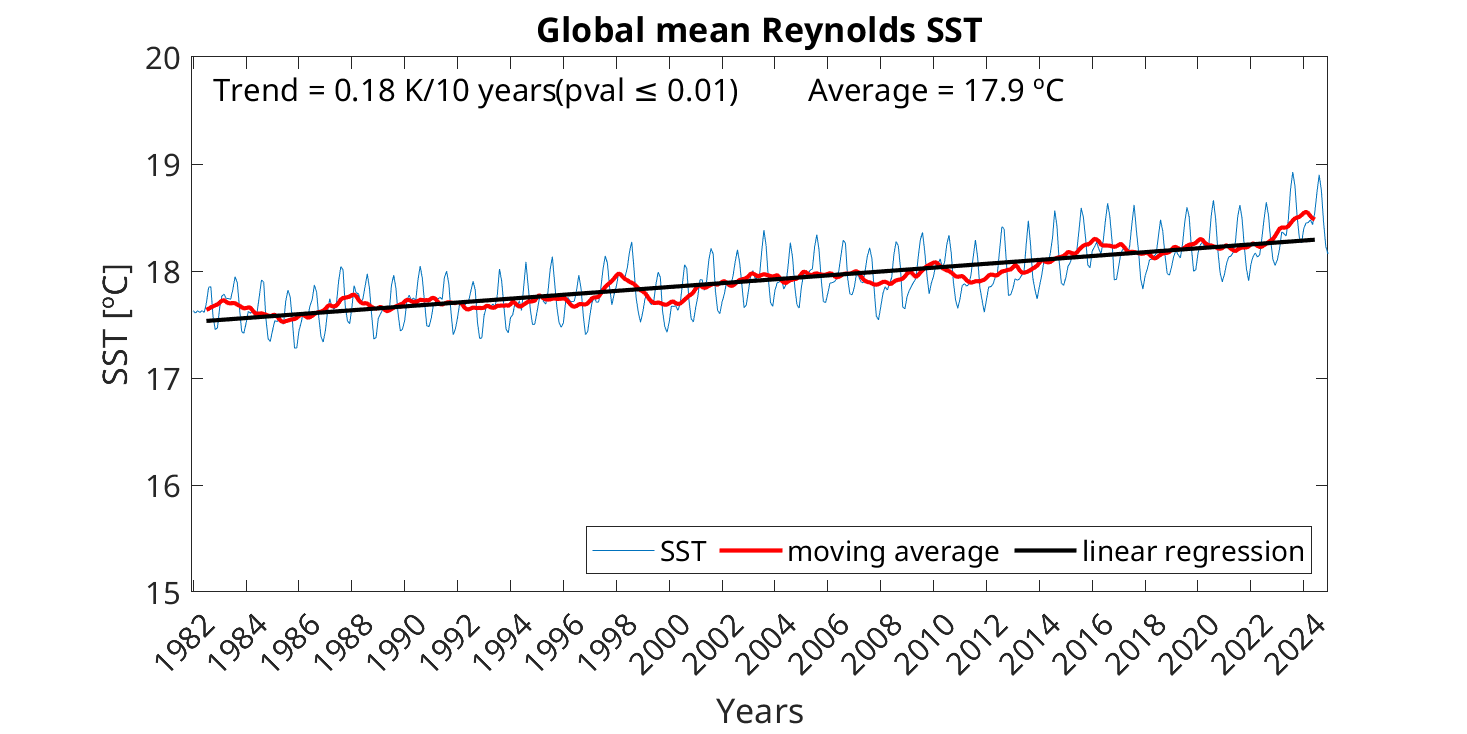
Down below in Fig. 2 we show three sample graphs for 10°W to 20°W for (a) 50°N-60°N, (b) 40°N-50°N, (c) 30°N-40°N. The fourth graph shows (d) Global mean reynolds SST trend 1982-2024.
All the Graphs are available on request from Stefan Kern (see contacts) or for internal access under TRENDS in the DATA folder.
Last update of data set at ICDC: May 22, 2025.
Parameters
| Name | Unit | Comment |
|---|---|---|
| SST | °C | |
| SST anomaly relative to 1971-2000 | °C | see description |
| Retrieval uncertainty | K | |
| Sea-Ice area fraction | - | 0 ... 1 |
| Name | Unit | Comment |
|---|---|---|
| SST | K | includes flag minimum ice extent |
| Mean retrieval uncertainty | K | |
| SST standard deviation | K | |
| Flag minimum ice extent | - | 0: ice, 1: ocean |
| Flag maximum ice extent | - | 0: ice, 1: ocean |
| Number of days used per month | - |
| Name | Unit | Comment |
|---|---|---|
| SST anomalie | K | Anomaly of the monthly SST with respect to mean monthly SST of periods 1982-2001 and 1992-2011 |
Coverage, spatial and temporal resolution
Period and temporal resolution:
- Daily: 1981-09-01 to 2025-04-30
- Monthly: 1982-01 to 2025-04 (means and anomalies)
Coverage and spatial resolution:
- Global
- Spatial resolution: 0.25° x 0.25°, cartesian grid
- Geographic latitude: -89.875°N to 89.875°N
- Geographic longitude: 0.125°E to 359.875°E
- Dimension: 1440 columns x 720 rows
- Altitude: 0.0 m
Format:
- NetCDF
Data quality
The offered daily data include an error estimation for each grid cell; see Reynolds et al. (2002; 2007) as well as the recent Technical Note in the references for details.
In addition, the daily data set includes the NCEP/NCAR Reanalysis sea ice concentration.
During the computation of the monthly mean SST ICDC found a number of inconsistencies:
- In Antarctica the land mask used seems to be incomplete and does not extend all the way to the water - for instance in the southwestern Weddell Sea. This creates artificial polynyas (= areas of open water in regions where according to the climatological conditions there should be sea ice) along the coast at places where polynyas are either completely absent or where actually existing polynyas are much smaller in size. ICDC mitigated these artifacts by using a different land mask (actually the one from the HadISST product). The artifacts could not be removed completely, though. Hence it is not recommended to interpret too much into SST along the Antarctic coast line.
- SST along the sea ice cover is treated as follows: Generally the monthly SST for a pixel is computed once the sea ice cover was < 50% on at least 6 days of the respective month. Pixels with 5 or less such days are flagged. The corresponding flag mask is included in the data set as "minimal ice extent". If the user would like to be more certain in excluding sea ice influence the second flag mask "maximum ice extent" can be used. This mask flags only those pixels as open water (=1) where on all days of the respective month the sea ice cover was < 50%. Note: Usage of a smaller threshold than 50% would have been desirable but yielded artificial ice cover along the coasts of, e.g. U.K. or Norway, and would hence have caused to flag SST in regions where we can be 100% sure that there is no sea ice. Note further that we relied only on the sea ice information provided along with the daily SST product.
- Data gaps: Sea ice cover data are missing in December 1987 and January 1988 in both hemispheres and are partly inconsistent in May 2009 in the northern hemisphere. For 1987 and 1988 we used the ice flag masks of the previous and the next months; for 2009 we build our ice flag masks on just 16 days instead of 31 days
- Our monthly SST product contains the mean monthly SST retrieval uncertainty as simple arithmetic mean over the daily SST retrieval uncertainty values. Any spatialtemporal correlations that might exist were not taken into account. Our monthly SST product contains in addition the temporal variability of the SST per pixel as one standard deviation of the mean SST for the respective month.
- Our SST anomaly product does not contain uncertainty information. The mean minimum ice extent of the reference period of the respective month is used to flag sea ice.
Contact
Stefan Kern
University of Hamburg
email: stefan.kern (at) uni-hamburg.deRichard W. Reynolds
NOAA / NESDIS / National Climatic Data Center
151 Patton Ave
Asheville, NC 28801
USA
email: Richard.W.Reynolds (at) noaa.govViva Banzon
NOAA / NESDIS / National Climatic Data Center
151 Patton Ave
Asheville, NC 28801
USA
email: oisst-help (at) noaa.gov
References
Literature:
- Reynolds, Technical Note: Whats-new-v2_Jan30_2009.pdf (pdf, not barrier-free)
- Reynolds, R. W., Rayner, N. A., Smith, T. M., Stokes, D. C., & Wang, W. (2002). An Improved In Situ and Satellite SST Analysis for Climate, Journal of Climate, 15(13), 1609-1625. https://doi.org/10.1175/1520-0442(2002)015<1609:AIISAS>2.0.CO;2
- Reynolds, R. W., T. M. Smith, C. Liu, D. B. Chelton, K. S. Casey, and M. G. Schlax, 2007: Daily high-resolution-blended analyses for sea surface temperature. Journal of Climate, 20, 5473–5496, doi:10.1175/JCLI-D-14-00293.1. https://doi.org/10.1175/JCLI-D-14-00293.1
- Banzon, V., Smith, T. M., Chin, T. M., Liu, C., and Hankins, W.: A long-term record of blended satellite and in situ sea-surface temperature for climate monitoring, modeling and environmental studies, Earth Syst. Sci. Data, 8, 165–176, https://doi.org/10.5194/essd-8-165-2016 , 2016.
Websites:
- Optimum Interpolation Sea Surface Temperature (OISST): https://www.ncei.noaa.gov/products/climate-data-records/sea-surface-temperature-optimum-interpolation
Data citation, License, and Acknowledgments
Please cite the data as follows:
Daily Reynolds - OISST sea surface temperature (AVHRR-only) data obtained from NOAAs' National Center for Environmental Information (NCEI) [last access: May 16, 2025]: https://www.ncei.noaa.gov/data/sea-surface-temperature-optimum-interpolation/v2.1/access/ , https://doi.org/10.25921/RE9P-PT57.
Banzon, V., Smith, T. M., Chin, T. M., Liu, C., and Hankins, W., 2016: A long-term record of blended satellite and in situ sea-surface temperature for climate monitoring, modeling and environmental studies. Earth Syst. Sci. Data, 8, 165–176, https://doi.org/10.5194/essd-8-165-2016
Reynolds, R. W., T. M. Smith, C. Liu, D. B. Chelton, K. S. Casey, and M. G. Schlax, 2007: Daily high-resolution-blended analyses for sea surface temperature. Journal of Climate, 20, 5473–5496, https://doi.org/10.1175/JCLI-D-14-00293.1
Should you use the monthly mean (anomaly) data, please include in the acknowledgements:
Monthly mean (anomaly) data based on these daily AVHRR-only SST data were computed at and provided by the Integrated Climate Data Center (ICDC), CEN, University of Hamburg.


