Sea surface salinity from SVP Drifters


Topics
- Access
- Description
- Parameters
- Coverage, spatial and temporal resolution
- Data quality
- Contact person
- References
- Data citation and License
Access
UNRESTRICTED:
RESTRICTED: This link to the data set is only available for a restricted user group. The data set is only accessible in CEN/MPI net or accessible from external nets with a customer account. Please contact ICDC if you would like to access this data from outside the network.
- Data access via file system: /data/icdc/ocean/svp_drifter_sss
Description
The ESA mission SMOS was planned with the aim of obtaining more precise data concerning the global water cycle. Constituents of the global hydrological cycle that can be measured with SMOS are
- the soil moisture,
- the ocean surface salinity, and
- the thin sea-ice thickness.
The validation of the sea surface salinity is very challenging because - among other reasons -
- only relatively few open ocean surface salinity measurements have been carried out and
- most open-ocean salinity measurements are carried out at depths which are too large to use the data without additional correction for the validation of satellite based (e.g. SMOS) sea surface salinity products.
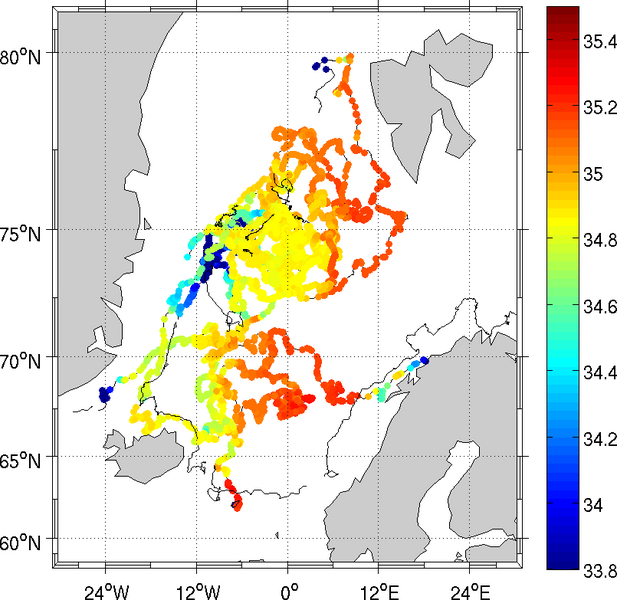
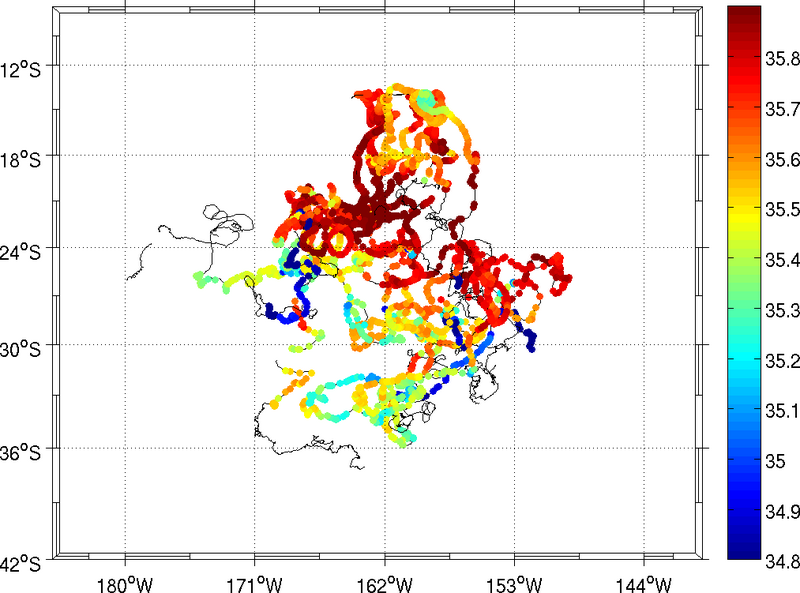
The data set offers here contributes to close this gap. This data set contains sea surface salinity and temperature measurements carried out by drifters of the "Surface Current Project (SVP)". The drifters comprise a spherical float under which the measurement devices are mounted, followed by a steel cable with a drogue. The float contains the telemetry and ensures position determination via the ARGO system plus data transfer. The salinity measurements are carried out with a Seabird conductivity cell (SBE37) mounted underneath the float at an approximate depth of 0.38 m. Temperature measurements are carried out with either one (at 0.45 m depth) or two (one at 0.15 m and one at 0.45 m depth) thermistors - depending on type of the drifter. For details of the sensor, deployment locations (two regions only: Northeast Atlantic, Southwest Pacific), processing and quality analysis we refer to the technical report in the references.
Last update of data set at ICDC: June 3, 2016.
Parameters
| Name | Unit |
|---|---|
| Sea surface salinity | g/kg |
| Sea water temperature at sensor 1 (upper sensor) | °C |
| Sea water temperature at sensor 2 (lower sensor) | °C |
| Corrected sea water temperature at sensor 2 | °C |
| Mean daily precipitation rate from satellite data | mm/h |
| Submergence | % |
| Quality flag temperature | - |
| Quality flag salinity | - |
| Voltage of battery | V |
Coverage, spatial and temporal resolution
Period and temporal resolution:
- variable
- every half an hour, based on 5 measurements within 5 minutes
Coverage and spatial resolution:
- Northeast Atlantic, Southwest Pacific
- Spatial resolution: variable, along track of drifter, depends on drift speed
- Geographical latitude: -89.5°N to 89.5°N
- Geographical longitutde: -179.5°E to 179.5°E
- Dimension: ~30 000 time steps
- Altitude: -0.38 m (salinity), -0.45 m (temperature)
Format:
- NetCDF
Data quality
The quality of this data set has been approved by means of an in-depth quality analysis and enhancement. This analysis has led to a substantial improvement of the data quality compared to the original measurements. These were not free of errors and unrealistic jumps in the measured salinity due to various factors: rain, wind, swell, intense solar radiation, changes in sensor characteristics, incomplete or erroneous data transfer. For details of data processing and quality analysis see the technical report.
Comparisons with independent salinity measurements were carried out. These reveal a RMS difference (mean difference) of 0.15 g/kg (0.006 g/kg) for a comparison with salinity measurements from ARGO profilers and a RMS difference (mean difference) of 0.13 g/kg (0.023 g/kg) for a comparison with salinity measurements from ships-of-opportunity. For more details of the validation we refer to the technical report and to Reverdin et al. (2014), see references.
Each data file contains a separate quality flag for the salinity and the temperature measurements for every time step.
Contact
Meike Sena-Martins
Institute of Oceanography / CEN, University of Hamburg
email: meike-sena.martins (at) uni-hamburg.deStefan Kern
ICDC / CEN / University of Hamburg
E-Mail: stefan.kern@uni-hamburg.de<br />(stefan.kern"AT"uni-hamburg.de)
References
Literature:
- Technical Report on processing and validation of Salinity data from surface drifters, Meike Sena Martins, University Hamburg, CEN, February 2016 (pdf, not barrier free)
- Anderson, J. E., and Riser, S. C. (2014), Near‐surface variability of temperature and salinity in the near‐tropical ocean: Observations from profiling floats, J. Geophys. Res. Oceans, 119, 7433– 7448, doi:10.1002/2014JC010112. https://doi.org/10.1002/2014JC010112
- Hormann, V., Centurioni, L. R., & Reverdin, G. (2015). Evaluation of Drifter Salinities in the Subtropical North Atlantic, Journal of Atmospheric and Oceanic Technology, 32(1), 185-192. https://doi.org/10.1175/JTECH-D-14-00179.1
- Reverdin, G., Morisset, S., Boutin, J., Martin, N., Sena-Martins, M., Gaillard, F., Blouch, P., Rolland, J., Font, J., Salvador, J., Fernández, P., & Stammer, D. (2014). Validation of Salinity Data from Surface Drifters, Journal of Atmospheric and Oceanic Technology, 31(4), 967-983. https://doi.org/10.1175/JTECH-D-13-00158.1
Websites:
Data citation, License, and Acknowledgments
Please cite the data as follows:
Surface Salinity Data measured by drifters of the Surface Velocity Project (SVP) were processed and validated by Meike Sena Martins (Main Author), Vasco Mueller and Benjamin Seelmann (University of Hamburg) and provided in netCDF file format by the Integrated Climate Data Center (ICDC), CEN, University of Hamburg, Hamburg, Germany.
License
The data was published under the Creative Commons Attribution 4.0 International License (CC-BY-4.0).
