Geostrophic Surface Velocity Anomaly

Topics
- Access
- Description
- Parameters
- Coverage, spatial and temporal resolution
- Data quality
- Contact person
- References
- Data citation
Access
UNRESTRICTED:
RESTRICTED: This link to the data set is only available for a restricted user group. The data set is only accessible in CEN/MPI net or accessible from external nets with a customer account. Please contact ICDC if you would like to access this data from outside the network.
- Data access via file system: /data/icdc/ocean/jtp_ocean_current
Description
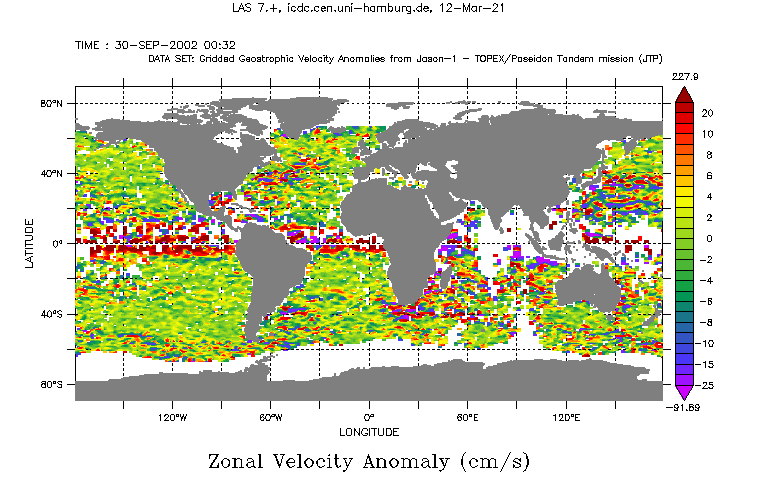
The subsequent data set consists of three years of geostrophic surface velocity anomalies derived from satellite altimetry. The satellite altimetry data was downloaded from the RADS data base (see references). The applied corrections are addressed in the data files itself.
What makes it unique compared to other geostrophic surface velocity data sets is, that: The geostrophic surface velocity anomalies discussed here, were calculated without applying any spatial or temporal interpolation and without the necessity to assume an isotropic ocean flow field.
Geostrophic surface velocity anomalies in zonal (u) and meridional (v) direction are computed from the Jason-1 - TOPEX/Poseidon (JTP) tandem mission data as was described in detail by Scharffenberg and Stammer [2010, chap. 2], Scharffenberg and Stammer [2011, chap. 2] and Brath et al., [2010, chap. 2] for the complete duration of the JTP tandem mission (09/2002 - 09/2005). As discussed there in great detail, velocity anomaly estimates for u and v are available from this approach every 6.2 km along a virtual center track as anomalies relative to the 3-year mean. The velocity anomalies can be derived as follows: Using two orthogonal SSH gradients, each aligned at a 45° angle to the cross-track direction, two orthogonal geostrophic velocity anomalies (˜u, ˜v ) can be calculated. Owing to the curvature of the track which changes as function of latitude, the distances over which both SSH gradients are calculated differ slightly for each position. A rotation of this set of velocity components (˜u, ˜v) finally yields a velocity vector of the velocity anomalies (u, v) in a Cartesian reference frame with zonal and meridional orientation on the interleaving (virtual velocity) track between the T/P and Jason-1 tracks. The method had been first devised by Stammer and Dieterich [1999], estimates of uncertainties where given by Leeuwenburgh and Stammer [2002] and velocity errors emerging from JTP data are shown in the work of Scharffenberg and Stammer [2010, Figure 3] (see references).
The data set consists of two products:
- Original resolution. Along track velocity anomaly estimates on the interleaving velocity track. The fields are provided for each 9.91 day repeat cycle (109) with variables sorted in ARCS (254) and measurements on each ARC (3127) (this product is not visualized on the LAS server)
- Gridded product from the along track data. The fields are provided as 2°x 1° gridded fields for each 9.91 day repeat cycle (109).
Last update of data set at ICDC:
Parameters
| Name | Unit |
|---|---|
| Time | days since 2000-01-01 |
| Geostrophic surface velocity anomaly: u-component | cm/s |
| Geostrophic surface velocity anomaly: v-component | cm/s |
| Error of geostrophic surface velocity anomaly: u-component | cm/s |
| Error of geostrophic surface velocity anomaly: v-component | cm/s |
| Flag | none (0, 1) |
| Name | Unit |
|---|---|
| Time | days since 2000-01-01 |
| Geostrophic surface velocity anomaly: u-component | cm/s |
| Geostrophic surface velocity anomaly: v-component | cm/s |
| Error of geostrophic surface velocity anomaly: u-component | cm/s |
| Error of geostrophic surface velocity anomaly: v-component | cm/s |
| Number of measurements per grid cell and repeate cycle (9.91 days) | - |
Coverage, spatial and temporal resolution
Period and temporal resolution:
- Sep. 30 2002 - Sep. 24 2005
- 9.91 days (repeat cycle)
Coverage and spatial resolution:
- Global
- Spatial resolution: 6.2 km along track; 2.0° x 1.0°, cartesian Grid
- Geographic latitude: -65.0°N to 65.0°N
- Geographic longitude: -180.0°E to 180.0°E
- Dimension: 254 x 3127 measurements (along track data); 180 columns x 180 rows (gridded data)
- Altitude: 0.0 m
Format:
- NetCDF
Data quality
An error of 4.2cm was assumed for each single SSH-measurement and propagated throughout the calculation of the velocity anomaly estimates. These error estimates are included in the data.
Contact
Martin Scharffenberg, mgs-research.jimdo.com
Telefon: 040 42838 5337
email: martin.scharffenberg (at) uni-hamburg.deStefan Kern
ICDC / CEN / University of Hamburg
E-Mail: stefan.kern"AT"uni-hamburg.de
References
Literature:
- Brath, M., M. G. Scharffenberg, N. Serra, and D. Stammer (2010), Altimeter-based estimates of eddy variability and eddy transports in the subpolar North Atlantic, Mar. Geod., 33(1), 472–503, doi:10.1080/ 01490419.2010.488921.
- Leeuwenburgh, O., and D. Stammer (2002), Uncertainties in altimetry-based velocity estimates, J. Geophys. Res., 107(C10), 3175,
doi:10.1029/ 2001JC000937. - Scharffenberg, M. G., and D. Stammer (2010), Seasonal variations of the large-scale geostrophic flow-field and of eddy kinetic energy inferred from the TOPEX/Poseidon and Jason-1 Tandem Mission Data, J. Geophys. Res., 115, C02008, doi:10.1029/2008JC005242.
- Scharffenberg, M. G., and D. Stammer (2011), Statistical parameters of the geostrophic ocean flow field estimated from the Jason-1 - TOPEX/Poseidon tandem mission, J. Geophys. Res., 116, C12011, doi:10.1029/2011JC007376.
- Stammer, D., and C. Dieterich (1999), Space-borne measurements of the time-dependent geostrophic ocean flow field, J. Atmos. Ocean. Technol., 16, 1198-1207.
Websites:
- RADS data base, http://rads.tudelft.nl
Data citation, License, and Acknowledgments
Please cite the data as follows:
Scharffenberg, M. G., and D. Stammer (2011), Statistical parameters of the geostrophic ocean flow field estimated from the Jason-1 - TOPEX/Poseidon tandem mission, J. Geophys. Res., 116, C12011, doi:10.1029/2011JC007376.
and with the following acknowledgments:
Global JTP geostrophic ocean surface velocity anomalies are distributed in netCDF format by the Integrated Climate Data Center (ICDC), CEN, University of Hamburg.
