Brightness Temperatures from L3B SMOS


Topics
- Access
- Description
- Parameters
- Coverage, spatial and temporal resolution
- Data quality
- Contact person
- References
- Data citation
Access
UNRESTRICTED:
- View TB data at LAS
- Get TB data via HTTP (wget shell script to get all data)
- Access TB data via OPeNDAP
RESTRICTED:This link to the data set is only available for a restricted user group. The data set is only accessible in CEN/MPI net or accessible from external nets with a customer account. Please contact ICDC if you would like to access this data from outside the network.
- Data access via file system: /data/icdc/ice_and_snow/smos_tb
Description
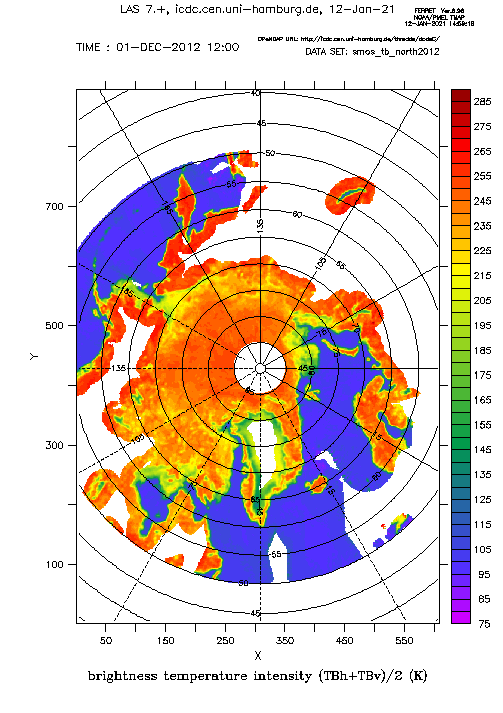
The Microwave Imagine Radiometer with Aperture Synthesis (MIRAS) aboard the SMOS satellite measures the Earth's surface brightness temperature at L-Band at a frequency of 1.4 GHz. These measurements are full polarimetric and are carried out at nadir incidence angles of between 0 and 65°. Both polar hemispheres are covered completely every day.
Here we offer mean daily brightness temperature intensities gridded onto a polar-stereographic grid with 12.5 km grid resolution. In order to do so, first all brightness temperature (TB) measurements carried out during one day at both polarizations (horizontal and vertical, h and v) and nadir incidence angles of between 0 and 40° are collected on the special SMOS ISEA grid (The special viewing geometry of SMOS required a special native grid.). TBh and TBv have to acquired within 2.5 s to form a data pair to be used. For each SMOS ISEA grid cell all TB values are averaged over the given incidence angle range to compute the brightness temperature intensity (TBh + TBv)/2. Subsequently, the data are interpolated onto the mentioned polar-stereographic grid.
Attention! Since Dec 2, 2016 version 3 is available. The data are reprocessed consistently using v620 L1C data. An improved data filtering method regarding to RFI and geophysical noises is applied in the processing chain from L1C to L3B, which improved the L3B data quality and availability.
The documentation reveals more details of the processing (see references).
This data set is a CliSAP/KlimaCampus product.
Last update of data set at ICDC:
Parameters
| Name | Unit |
|---|---|
| Brightness Temperature Intensity | K |
| Brightness Temperature Intensity standard deviation | K |
| Number of TB data pairs per grid cell | - |
| Relative fraction of RFI contaminated grid cells | % |
Coverage, spatial and temporal resolution
Period and temporal resolution:
- 01/01/2010 - 30/09/2019
- Daily
Coverage and spatial resolution:
- Northern & Southern hemisphere poleward of 50°N & 50°S, respectively
- Spatial resolution: 12.5 km x 12.5 km, polar-stereographic grid of the NSIDC (see references), centered at 70°N and 70°S, respectively
- Geographic longitude: 0°E to 360°E
- Geographic latitude: 50°N and 50°S to 90°N and 90°S, respectively
- Dimensions: 608 columns x 896 rows (Northern hemisphere), 632 columns x 664 rows (Southern hemisphere)
- Altitude: 0.0m
Format:
- NetCDF
Data quality
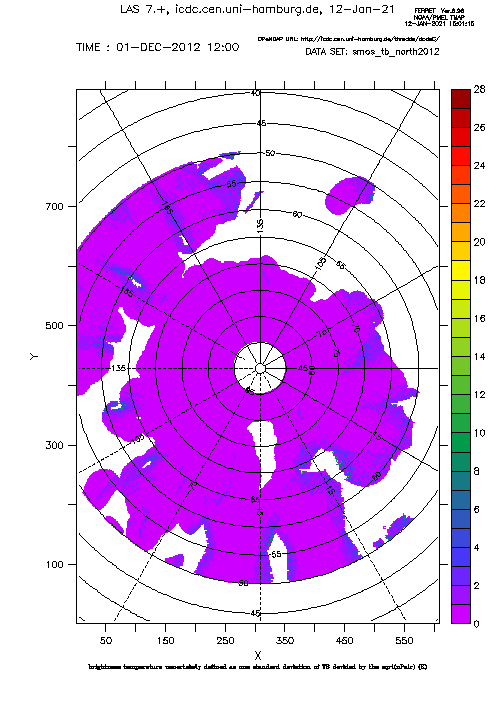
This data set contains the standard deviation of the TB intensity. For this all TBh / TBv pairs that are used to compute the daily average TB intensity for the respective ISEA grid cell are considered. The resulting standard deviation values are interpolated into the 12.5 km grid and are a measure for the variation of TB Intensity for the respective day and incidence angle range of 0-40°. An estimation of the representativity of these standard deviations is possible with the number of TBh - TBv data pairs given in the data set as well, also interpolated into the 12.5 km grid.
Radio Frequency Interference (RFI) is one of the major problems in SMOS data processing. Although RFI sources are known and a lot has been done in the past to mitigate RFI influence on SMOS data by deleting RFI sources still RFI cannot be excluded. Therefore the data set contains in addition for each grid cell the relative fraction of TB data pairs that have been discarded from the computation of the TB intensity because of RFI. More details can be found in the documentation mentioned in the references.
Data gaps exist during the Commissioning Phase (Jan.-May 2010) and from Dec. 27-31, 2010, due to problems with the antenna.
Contact
Project Scientist
Xiangshan Tian-Kunze
email: xiangshan.tiankunze (at) awi.dePrincipal Investigator
Lars Kaleschke
Alfred Wegener Institute for Polar and Marine Research / Bremerhaven
email: lars.kaleschke (at) awi.deStefan Kern
ICDC / CEN / University of Hamburg
E-Mail: stefan.kern"AT"uni-hamburg.de
References
Literature:
- Documentation SMOS Daily Polar Gridded Brightness Temperatures (L3B), Tian-Kunze et al., 2016 (pdf, not barrier-free)
- Kaleschke et al., Sea ice thickness retrieval from SMOS brightness temperatures during the Arctic freeze-up period, GEOPHYSICAL RESEARCH LETTERS, VOL. 39, L05501, doi:10.1029/2012GL050916, 2012, (pdf, not barrier-free)
Websites:
- NSIDC Geocoordinate and Pixel-Area Tools, https://nsidc.org/data/polar-stereo/tools_geo_pixel.html
Data citation
Please cite the data as follows:
X. Tian-Kunze, L. Kaleschke, and N. Maass (2012), updated current year. SMOS Daily Polar Gridded Brightness Temperatures, [list dates of temporal coverage used]. ICDC, CEN, University of Hamburg, Germany, Digital media.
and with the following acknowledgments:
Thanks to ICDC, CEN, University of Hamburg for data support.
