Equatorial Kelvin waves in ERA5 reanalyses
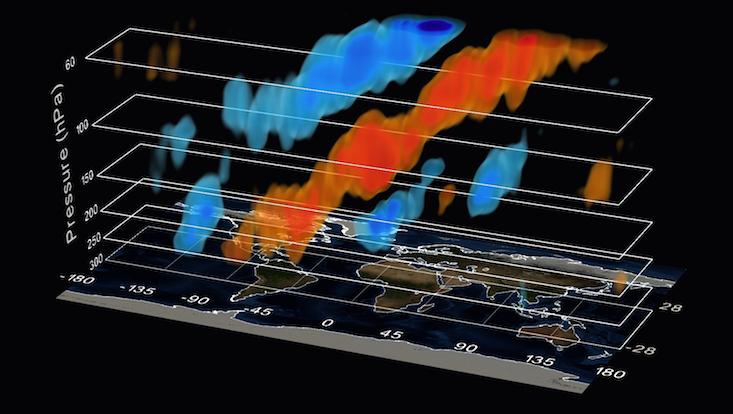
The visualization shows 3-D atmospheric Kelvin waves in daily ERA5 data filtered by MODES. The simulation was provided by Prof. Nedjeljka Žagar and performed by the "Clouds and Tropical Circulation" group, Project A2, the Cluster of Excellence "Climate, Climatic Change, and Society” (CLICCS).

Equatorial Kelvin waves in ERA5 reanalyses
Kelvin wave filtering was performed using 3D linear wave theory. Data are processed in a terrain-following coordinate system using MODES software, http://modes.cen.uni-hamburg.de. MODES performs a multivariate projection of wind and geopotential fields onto the horizontal structure functions for Kelvin waves with many zonal wavenumbers and vertical structures. The projection does not involve the time dimension, and no smoothing is applied. Concatenated results reveal the quasi non-dispersive nature of large-scale Kelvin waves. Vertically-propagating Kelvin waves are dominated by zonal wavenumber 1 and periods 10-14 days. The impact of the Andes and the orography of East Africa is noticeable.
The visualized variable is the zonal wind. Westerlies/easterlies are shown in blue/red shades from +/- 2 m/s to +/- 12 m/s. Input ERA5 data (C ECMWF) are 12:00 UTC analyses over 40 years, 1980-2019. Only 2010 is shown in the video for levels between 300 hPa and 60 hPa. Note: the selected data levels shown in the visualization were represented lowered closer to the surface of Earth for enhanced visibility reasons.
