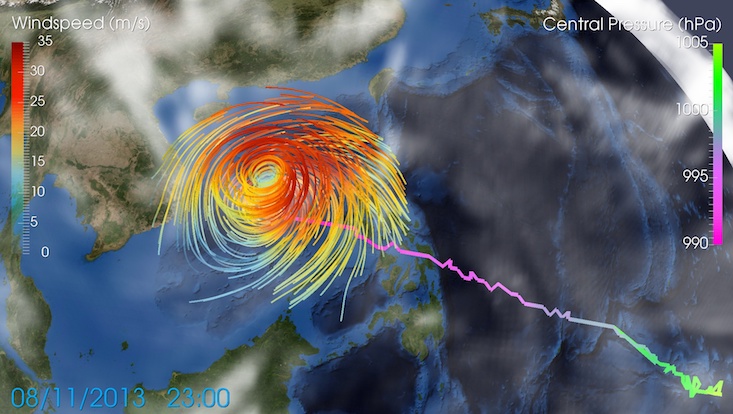
Simulation of Cyclone Christian and Typhoon Haiyan
In this movie, the time period August 2013 to March 2014 is shown. It includes the typhoon season 2013 and winter storms over the North Atlantic and Western Europe.
Two storms are presented in more detail: extra-tropical cyclone Christian which crossed the North Sea in October 2013 and typhoon Haiyan, which struck the Philippines in November 2013.

Simulation of Cyclone Christian and Typhoon Haiyan
Storm Christian originated close to Newfoundland and proceeded along the Atlantic towards southern England before it passed the North Sea and hit Denmark on October 28. There it lead to the highest wind speeds and gusts on record (39.5 m/s 10-minute sustained wind speed in Røsnæs Fyr and 53.5 m/s gusts at Kegnæs Fyr). Also northern Germany was strongly affected by high wind speeds up to Beaufort 12. The storm then passed southern Sweden and Finland before it moved on towards Russia where it finally weakened.
In November 2013 one of the strongest typhoons on record caused thousands of fatalities and large damages especially in the Philippines. Tropical cyclone Haiyan originated in the Northwestern Pacific and while moving westward towards Palau rapidly intensified up to a typhoon of category 5 on the Saffir-Simpson hurricane wind scale. Then the typhoon intensified further up to maximum 10-minute sustained wind speeds of about 285 km/h over the Philippines. It then continued westward over the South China Sea and made landfall in northern Vietnam before it decayed afterwards.
For the visualization, a tracking algorithm was used to select cyclone tracks of Christian and Haiyan. The program detects local minima of sea level pressure and searches for the maximum wind speeds in a circle around these pressure minima. In a next step, the minima are connected to cyclone tracks. Several tracking criteria were applied in order to choose the cyclones of interest, like a certain wind speed threshold, duration time and maximum vertical wind shear.
Dataset description
A new global atmospheric climate simulation for the past 67 years was performed with the state-of-the-art general circulation model ECHAM6 using the triangular truncation T255 and 95 levels (Schubert-Frisius et al., 2016). In order to gain realistic past weather patterns, global NCEP1 reanalysis data, which contain a multitude of weather measurements like station, ship, aircraft or satellite data, were used to keep the climate model close to observations. This was done with the spectral nudging technique (von Storch et al., 2000), whereby large-scale climate model results are nudged towards large weather states of a reanalysis data set.
With this method, a high-resolution data set from 1948 until 2015 was computed, that contains both realistic large weather patterns and regional details which cannot be resolved by the coarser reanalysis data. Large-scale circulation systems like the North Atlantic Oscillation or the Indian monsoon are simulated close to observations. An added value in comparison to coarser reanalysis data can be gained for smaller phenomena like tropical or extra-tropical cyclones (Feser et al., 2015) or regional storms. The resolution of the data is about 80 km, the output is hourly, and more than 200 meteorological variables are available. It is available via the CERA data base of the German Climate Computing Center DKRZ:
http://cera-www.dkrz.de/WDCC/ui/Compact.jsp?acronym=CLISAP_MPI-ESM-XR_t255l95
References
Schubert-Frisius, M., F. Feser, H. von Storch, S. Rast, 2016: Spectral Nudging Sensitivity Study using an AGCM. Submitted to Mon. Wea. Rev.
Feser, F., M. Barcikowska, S. Haeseler, C. Lefebvre, M. Schubert-Frisius., M. Stendel, H. von Storch and Matthias Zahn, 2015: Hurricane Gonzalo and its extratropical transition to a strong European storm. [in "Explaining Extreme Events of 2014 from a Climate Perspective"]. Bull. Amer. Meteor. Soc., 96(12), S51-S55.
von Storch, H., H. Langenberg, and F. Feser, 2000: A Spectral Nudging Technique for Dynamical Downscaling Purposes. Mon. Wea. Rev. 128(10) 3664-3673.
