Tropical low-frequency variability associated with the Kelvin waves
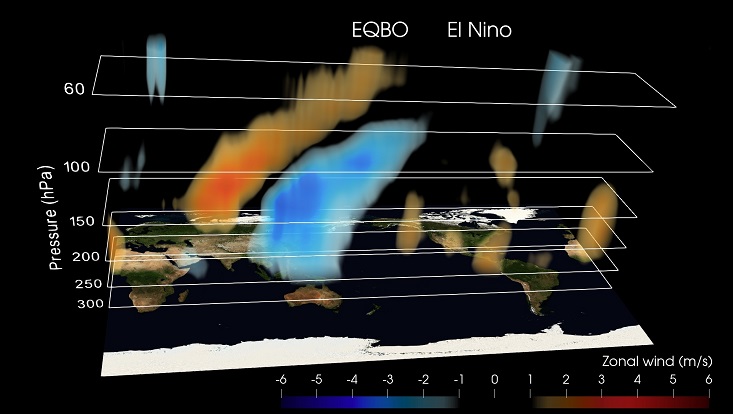
The movie shows the 40-year evolution of tropical low-frequency variability projecting on the Kelvin wave structure in ERA5 reanalyses. The simulation was provided by Prof. Nedjeljka Žagar and performed by the "Clouds and Tropical Circulation" group, Project A2, the Cluster of Excellence "Climate, Climatic Change, and Society” (CLICCS).

Tropical low-frequency variability associated with the Kelvin waves
Three-dimensional Kelvin wave filtering was performed using classical linear wave theory. Daily data at 12 UTC on 43 terrain-following levels and the horizontal grid made of 256x128 points are analyzed using the MODES software, http://modes.cen.uni-hamburg.de. MODES performs a multivariate projection of the winds and geopotential fields onto the horizontal structure of for Kelvin waves for 100 zonal wavenumbers. In the vertical direction, 27 vertical structure functions are used; i.e. the projection involved Kelvin wave solution for 100 waves and 27 equivalent depths (or 27 shallow-water equation systems). The longest Kelvin wave period among the 2700 waves is about 50 days. Note however, that the time dimension (i.e. frequency) is not involved in filtering, and no smoothing is applied on the input data and results of the spatial filtering. Concatenated time series of daily Kelvin wave zonal winds are analyzed by the Fourier series in time to remove subseasonal periods. The resulting low-frequency variability includes only periods longer than 90 days.
The visualized variable is the zonal wind. Westerlies and easterlies are shown in blue and yellow-red shades, respectively, for levels between 300 hPa and 50 hPa, and the period 1980-2019. The meridional extent of the visualisation domain is 28 degrees off the equator. Periods of the easterly and westerly phase of the quasi-biennial oscillations (EQBO and WQBO, respectively) are defined by the standardized 30 hPa zonal wind index from NOAA Climate Prediction Center https://www.cpc.ncep.noaa.gov/data/indices/qbo.u30.index.
Periods of El Nino and La Nina are defined by anomalies of the Nino3.4 index, https://www.cpc.ncep.noaa.gov/data/indices/ersst5.nino.mth.91-20.ascii, exceeding one standard deviation. The ERA5 reanalysis data is available via Copernicus Climate Change Service, https://climate.copernicus.eu/climate-reanalysis.
Temporal variability associated with the horizontal structure of the Kelvin wave is largely in the zonal wavenumber 1. The Walker circulation over the Pacific ocean and variability associated with the QBO and ENSO can be noticed. Day-to-day Kelvin wave evolution in 2010 is available at https://youtu.be/aiVrPu6AxwA. Note: the selected data levels shown in the visualization were represented lowered closer to the surface of Earth for enhanced visibility reasons.
