SPI - Standardized Precipitation Index
Topics
- Access
- Description
- Parameters
- Coverage, spatial and temporal resolution
- Data quality
- Contact person
- References
- Data citation and License
Access
UNRESTRICTED:
RESTRICTED: This link to the data set is only available for a restricted user group. The data set is only accessible in CEN/MPI net or accessible from external nets with a customer account. Please contact ICDC if you would like to access this data from outside the network.
- Data access via file system: /data/icdc/climate_indices/standard_precipitation_index_SPI
Description
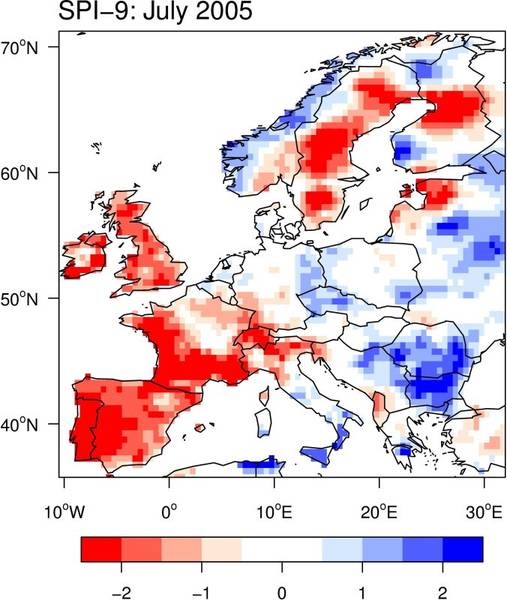
The "Standardized Precipitation Index" (SPI) is used to describe extremely dry or wet climate situations. The World Meteorological Organization (WMO) recommends, that all national meteorological and hydrological services should use the SPI for monitoring of dry spells (Press report December 2009, WMO No. 872).
The advantages of SPI usage are:
- Only precipitation data are needed for the calculation of the index.
- The index is a standardized measure for precipitation in different climatic regions and for seasonal differences.
- Calculated for different time scales: meteorological, agricultural-economic and hydrological.
Version 1 was a CLISAP P2 project.
Definition of SPI classes
| SPI Value | Interpretation |
|---|---|
| SPI ≤ -2 | Extremely dry |
| -2 < SPI ≤ -1.5 | Severely dry |
| -1.5 < SPI ≤ -1 | Moderately dry |
| -1 < SPI ≤ 1 | Near normal |
| 1 < SPI ≤ 1.5 | Moderately wet |
| 1.5 < SPI ≤ 2 | Severely wet |
| SPI ≥ 2 | Extremely wet |
Calculation
The SPI, presented here, is different from the original SPI definition of McKee et al. 1993. An enhanced SPI is used, that significantly reduces errors resulting from the determination of the precipitation's distribution (Sienz et al. 2011). MC Kee et al. 1993 shifted the time series of the SPI one time step into the future, but this is not done for the calculation of the SPI presented here.
Version 2: The SPIs (1, 3, 6, 9, 12, 24, 48) were calculated from the Climate Research Unit (CRU) precipitation data set, Version: CRU TS 4.05 for the period 1901 - 2020 for Europe and USA. It is an update and replaces the SPI from CRU by Frank Sienz. The reference period used for calculation of all distributions of CRU Version 2 is 1901-2020. As various changes were made to the scripts, comparisons with examples of the results were made to ensure the quality of the data. The date specified in the files always indicates the end of the period under consideration.
The SPI was calculated from two precipitation data sets:
- SPI Version 1: European Climate and Data Assessment (ECA&D), E-OBS gridded dataset Version 4.0
- SPI Version 2: Climate Research Unit (CRU), Version: 4.05, (Version 1: CRU TS 2.1)
Last update of data set at ICDC: 07/2022
Parameters
| Name | Unit / Comment |
|---|---|
| Standardized Precipitation Index | dimensionless |
| Time scales | 1, 3, 6, 9, 12, 24 and 48 months |
Coverage, spatial and temporal resolution
SPI (ECA&D Precipitation), Europe
Time period:
- January 1951 to December 2010, monthly
Geographically:
- Longitude 25.75W to 75.25E (Resolution: 0.5 degree)
- Latitude 35.25N to 71.75N (Resolution: 0.5 degree)
SPI (CRU Precipitation), Europe and USA
Time period:
- January 1901 to December 2020, monthly
Geographically (Europe):
- Longitude 25.75 W to 75.25E (Resolution: 0.5 degree)
- Latitude 35.25N to 71.75N (Resolution: 0.5 degree)
Geographically (USA):
- Longitude 125.75W to 60.25W (Resolution: 0.5 degree)
- Latitude 24.25N to 49.75N (Resolution: 0.5 degree)
Format:
- NetCDF
Data quality
The quality of the SPI can not be better than the quality of the precipitation data used for its calculation. Inhomogeneities in the observed time series, the interpolation to the grid, as well as the irregular distribution of stations in space and time also affect the data presented here. On the quality of ECA &Ddata, see Haylock et al. (2008) and van den Besselaar et al. (2011) and for CRU data see Mitchell and Jones (2005).
Contact
Frank Sienz
MPIfM, Hamburg
frank.sienz (at) mpimet.mpg.deAnnika Jahnke-Bornemann
ICDC / CEN / University of Hamburg
E-Mail: annika.jahnke-bornemann"AT"uni-hamburg.de
References
Literature:
- McKee, T.B., Doeskin, N.J. and Kleist, J.: The relationship of drought frequency and duration to timescales, in 8th Conf. on applied climatology, pp. 179-184, American Meteorological Society, Anaheim, Canada, 1993.
- Sienz, F., Bothe, O., and Fraedrich, K.: Monitoring and quantifying future climate projections of dryness and wetness extremes: SPI bias, Hydrol. Earth Syst. Sci., 16, 2143–2157, https://doi.org/10.5194/hess-16-2143-2012 , 2012.
Data ECA&D:
- European Climate and Data Assessment (ECA&D)
- Haylock, M.R., Hofstra, N., Klein Tank, A.M.G., Klok, E.J., Jones, P.D., New, M.: A European daily high-resolution gridded dataset of surface temperature and precipitation. J. Geophys. Res (Atmospheres), 113, D20119, 2008.
- van den Besselaar, E.J.M., Haylock M.R., van der Schrier, G. and Klein Tank, A.M.G.: A European daily high-resolution observational gridded data set of sea level pressure. J. Geophys. Res., 116, D11110, 2011.
Data CRU:
- Climate Research Unit (CRU)
- Mitchell, T.D and Jones, P.D.: An improved method of constructing a database of monthly climate observations and associated high-resolution grids, Int. J. Climatol., 25, 693-712, 2005.
- CRU TS 2.1 data-set documetation
Data citation, License, and Acknowledgments
Please cite the data as follows:
For ECAD and CRU Version 1:
Sienz, Frank. (2011). SPI - Standardized Precipitation Index from CRU / ECAD for EU and USA (Version 1) [Data set]. http://doi.org/10.25592/uhhfdm.10239
For CRU Version 2:
Jahnke-Bornemann, Annika. (2022). SPI - Standardized Precipitation Index from CRU for EU and USA (Version 2) [Data set]. http://doi.org/10.25592/uhhfdm.10255
and with the following acknowledgment:
Thanks to ICDC, CEN, University of Hamburg for data support.
License
The data was published under the Creative Commons Attribution 4.0 International License (CC-BY-4.0).


