CEN - Center for Earth System Research and Sustainability
Centerfor Earth System Research and Sustainability (CEN)
Photo: UHH/Denstorf
27 February 2017, by CEN Universität Hamburg
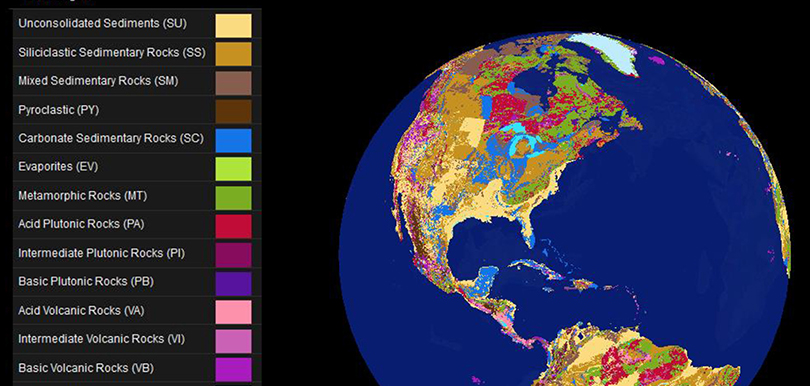
Photo: UHH/CEN/CliSAP
Zoom in and out and rotate the globe: The interactive lithological world map presents a very accurate picture of the Earth’s crust beneath its thin surface layer..
Zoom in and out and rotate the globe: The interactive lithological world map presents a very accurate picture of the Earth’s crust beneath its thin surface layer. The characteristics of rocks are represented approximately 100 times more accurately than in previous maps. The global rock type information was translated into 16 lithological classes and numerous subclasses, which can be combined in more than 400 different ways. The whole map is represented by a point cloud of more than 210 million points.
Therefore, the new map offers an important database to model various processes at the Earth surface as well as assessing geohazards more precisely. For example, limestone (shown in blue) dissolves quite quickly and forms very impressive cave systems. However, when these caves collapse, it results in large holes at the surface. At the same time, the map offers important data for climate research. For instance, the weathering of certain rocks reduces the concentration of the greenhouse gas CO2 in the atmosphere by bounding CO2 in water.
Find the globe here
Data authors: Jens Hartmann and Nils Moosdorf/ CEN
Visualization by Felicia Brisc, CliSAP/CEN