A picture says more than a thousand numbers
19 February 2019, by Dr. Nuno Serra, CEN Universität Hamburg

Photo: UHH/CEN/N.Sera
Supercomputers create huge volumes of data, which are difficult to decipher – unless researchers turn them into a film.

As an oceanographer, I’m interested in the physics of the oceans. Which forces set the waters of the world in motion? What patterns are found in ocean currents? There have been many new discoveries in the field over the last 50 years: e.g. internal waves, which can travel hundreds of kilometers under the water’s surface, or rapidly occurring eddies that disappear again just as quickly, and which briefly incorporate tremendous volumes of water. Like the well-known Gulf Stream and other ocean currents, they are a part of our climate system, transporting and distributing heat and energy.
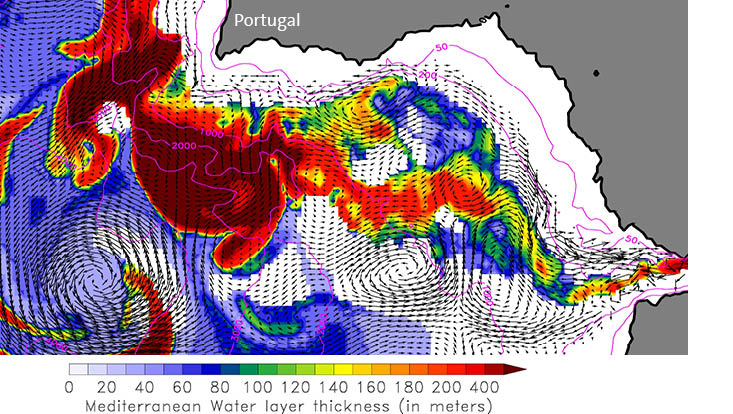
Together with colleagues from Universität Hamburg’s Center for Earth System Research and Sustainability (CEN), I am closely examining these eddies. I actually first came across them a few years ago. Back then, I was investigating the salty and warm currents that flow from the Mediterranean into the Atlantic off the southern coast of my home country, Portugal. On some days, this current creates a clearly recognizable layer that is up to 200 meters thick and three degrees Celsius warmer than the water above it. On other days, the layer is thinner, and on some, it’s not there at all.
To understand why that is the case, I made computer simulations of the currents. To do so, I incorporated information on local conditions, like the shape of the coastline and bottom topography, as well as my own-recorded temperature and salinity data, and the physical laws that apply on Earth. In return, the computer churned out columns of difficult-to-interpret numbers. However, they all started making sense when I began converting them into pictures, putting together several “snapshots” of the water properties and currents to make a film.
Suddenly I was able to see how the warm Mediterranean current becomes tangled in the Atlantic, creating eddies. Depending on their rotational speed, they can be wide and flat, or narrow and reaching great depths – similar to pirouetting ice skaters, who spread their arms in order to rotate slowly or hold them over their head to spin faster. My film revealed how rapidly turning surface eddies draw Mediterranean water at their centers, and how gaps filled with cold Atlantic water form between those eddies; there one will not find any warm Mediterranean water.
Since then, I have worked with visualizations whenever possible. They make it much easier for me to understand complex processes and draw conclusions about them. For instance, a recent film showed the ocean’s behavior over the ridge between Greenland and Norway: a region where the Gulf Stream ends and the cold water from the north begins to sink into the depths of the Atlantic. The visualizations enabled me to understand why this does not occur continuously but in individual bursts. Once again, eddies come into play: whenever an eddy from the north crosses the ridge, a certain volume of cold water sinks down.
Today, visualizations have become crucial for climate and Earth system research. A number of my colleagues have even specialized in this area: at the CEN’s Climate Visualization Laboratory, they create animated journeys into fantastic worlds that can’t be seen with the naked eye. These films are especially valuable for those researchers who deal with such transient and chaotic phenomena as eddies. They help us to refine our understanding of the physical processes at work on our planet – and with them, the climate system, its components, and potential future developments.
Dr. Nuno Serra is a physical oceanographer at Universität Hamburg’s Institute Institute of Oceanography and a member of the Center for Earth System Research and Sustainability (CEN).
This article was first published as a guest article in the Hamburger Abendblatt as part of a monthly series on climate research. Here you can find more articles of the series.


