Taking a closer look at our oceans
17 August 2018, by CEN Universität Hamburg

Photo: Corinna Harl, www.micori.de
What shape are our oceans in? Which protective measures are sensible? A new computer model promises to help find the best assessment criteria.
According to the targets set by the European Union, by 2020 our oceans are meant to be clean, healthy and productive; a laudable goal. In order to reach that goal, the EU’s individual Member States have to first know what state the oceans are in. How can they best find this information? And how can they translate what they learn into suitable measures and policies? These are the types of questions that my colleagues at Universität Hamburg’s Center for Earth System Research and Sustainability (CEN) and I are currently investigating.
The EU has subdivided the ecosystem “oceans” into various components: just like a doctor, who examines a patient’s cardiovascular system, digestive tract and immune system separately. In turn, the EU has defined the ideal state for each component. For example, there should be a diverse range of flora and fauna, and as many edible fish as possible. In addition, all parts of the food web – animals, plants, bacteria and many more – should be sufficiently abundant to ensure their long-term survival.
The food web also includes all predator-prey relations: fish feed on microorganic fauna called zooplankton, which in turn feed on algae. Bacteria feed on and decompose all dead organic material. The component ‘food web’ is an important one in terms of assessing the overall state of the oceans. Nevertheless it remains difficult to find indicators that offer clear information on the oceans’ status. For human beings, body temperature is a good indicator: if it’s too high, we know the person in question has a fever – and their health status is poor.
We tested 13 common indicators for three regions of the Baltic Sea. Scientists frequently use all 13 to assess the status of the food web – but are they actually suited to the task? Seven of the indicators concern fish; the remaining six focus on zooplankton: How many are there? And how large are they on average?
To determine how well the indicators work, we’ve developed a computer model, which we supply with data on the indicators, and on environmental influences like climate change or overfertilization. A good indicator shows us the current state of the food web, and can quickly and clearly react to specific environmental influences. If the zooplankton are becoming smaller on average, it indicates that the food web is in poor shape. One possible cause is overfertilization – if we can verify this connection with proof, the remedy is clear: less fertilizer in the water.
Despite countless calculations, there’s no such thing as a single, universally applicable indicator. For example, the total amount of zooplankton was a good indicator for the state of the food web in the Bornholm Basin and the Bothnian Sea between Sweden and Finland, yet proved wholly unreliable for the Gotland Basin. Further, in the Bornholm Basin the average size of the zooplankton showed only a minimal change in response to certain environmental influences. Depending on the region, up to half of the indicators failed to respond as expected to changes in the environment. For the Bornholm Basin, six of the indicators proved to be suitable for evaluating the status of the food web; for the other two regions, other combinations proved to be a better fit.
Accordingly, suitable indicators have to be selected for each individual region. Our model can help members of the research and political community to identify the best candidates, ensuring that it will be easier to assess the state of our oceans in the future – the first step toward achieving the goal of cleaner and healthier oceans by 2020.
This content was first published as a guest article in the newspaper Hamburger Abendblatt 13th of August 2018.
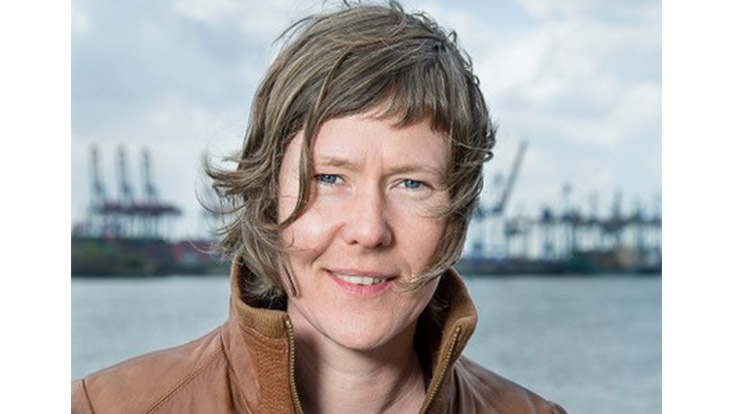
Dr. Saskia Otto is a biologist and works at Universität Hamburg’s Institute of Marine Ecosystem and Fishery Science.


