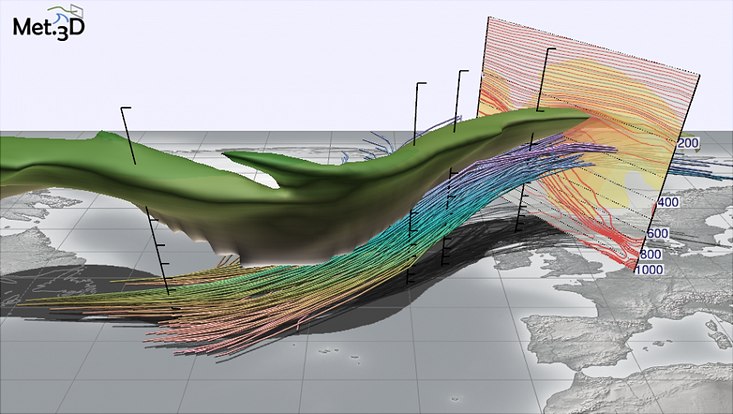
Weather and Climate: Now in 3D
25 April 2022, by Marc Rautenhaus

Photo: Met.3D
What will the weather be like tomorrow, or the climate be like 20 years from now? Today, these questions are answered using complex computational models that spit out lists of numbers as long as your arm. These tremendous amounts of data often have to subsequently be transformed into graphics or maps – which are most often two-dimensional – to decipher their meaning. But what if I could explore the atmosphere hands-on, in 3D?

While working as a meteorologist in Munich, I often asked myself this question. There I was involved in planning research flights. My job was to determine routes with the highest probability of certain interesting meteorological phenomena occurring on them. To do so, I often had to make predictions for the upcoming flight on short notice: where would the clouds we were looking for be formed? What way would clouds of smoke from forest fires drift? I had to reconstruct these three-dimensional processes using 2D maps, which was painstaking and time-consuming work.
Other fields have made major advances in this regard. For instance, in computer games I can walk through virtual worlds that respond to my every move. Couldn’t we do the same thing with scientific data? The interface between meteorology and IT was something that had fascinated me for years. So, I started experimenting with graphics hardware from the gaming field in order to visualize meteorological data in a 3D environment. I programmed a new software package that allowed the data to be displayed interactively. At the CEN, Universität Hamburg’s Center for Earth System Research and Sustainability, I’m currently working to refine this tool.
Thanks to the graphic cards’ computing power, the images are rapidly and fluidly displayed, allowing me to directly investigate meteorological phenomena. I can scroll through the atmosphere horizontally or vertically and immediately see the results in 3D. In this way, I can identify interesting or new phenomena intuitively, without the need for lengthy searches.
This represents an important step forward for the research community, since interactive 3D graphics can help to reveal even hidden processes. To date, forecasting data has normally been reviewed using 2D maps. Only when part of the data is particularly interesting are 3D images or animations created in order to better grasp the processes at work in the atmosphere. In other words, if 3D imaging is used at all, then only at the end of the analysis. But with the new software, which I call Met.3D, all data can be investigated in 3D from the beginning.
A real limitation on the software is how much data the graphics memory can handle. Accordingly, our team is now working to further reduce the amount of data. This can be done, for instance, by teaching the program to automatically recognize certain atmospheric patterns like cold or warm fronts. So, if we want to take a closer look at cold fronts, we search for them in the data and filter out the results, which means we then only need to transfer this data to the graphics memory.
In the future, I’d like to explore how the program could create added value in education. I’m convinced that students could much more easily understand atmospheric processes if they could see the interactions for themselves and in 3D.
More Information
Atmospheric scientist and computer scientist Dr. Marc Rautenhaus conducts research on the visualization of scientific data at Universität Hamburg’s Center for Earth System Research and Sustainability (CEN) and Regional Computing Center (RRZ).
Met.3D website
Newspaper: This article was first published as a guest article in the Hamburger Abendblatt as part of a monthly series on climate research. Find all articles of the series here.


