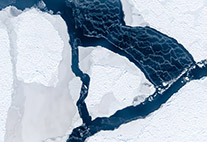
Researchers simulate the emergence of leads in sea ice
19 July 2016, by Franziska Neigenfind

Photo: IceCam/Stefan Hendricks
Scientists from the Alfred-Wegener-Institute (AWI) and the University of Hamburg have succeeded in realistically simulating the emergence of large channels in the Artic sea
Scientists from the Alfred-Wegener-Institute (AWI) and the University of Hamburg have succeeded in realistically simulating the emergence of large channels in the Artic sea ice in a computer model. This allows the modelling of the heat fluxes between the ocean, ice and the atmosphere.
Two approaches were decisive for this success: On the one hand, the researchers had increased the spatial resolution of the FESOM AWI sea-ice ocean model. On the other hand, they were able to improve the numerical solution to the equation so that the simulation of the lead formation holds up well when compared to real sea-ice satellite data. They reported this success in a study that appeared online in the professional journal, Geophysical Research Letters.
In the winter, the Arctic sea ice covers an area of 14 to 16 million square kilometres and creates a relatively thin “skin” between the ocean and the atmosphere. The amount of heat and substances exchanged between the ocean and the atmosphere depends largely on the number of cracks and leads there are in the sea ice. Even in cold winters, more and more leads are forming due to wind and currents, which only adds up to a small amount of the total area, but is responsible for a large part of the growth in ice.
Even though leads in the sea ice cover play a decisive role in the arctic climate system, scientists have only now been able to create a realistic computer model configuration for simulation. Two factors were decisive for leading to this breakthrough: On the one hand, the scientist involved with the AWI climate modelling, Qiang Wang, increased the resolution for the simulation of the global AWI sea-ice model FESOM (Finite Element Sea-ice Ocean Model) in the arctic from 111 kilometres to some 4 kilometres per grid point. On the other hand, they have managed to improve the numerical solution when solving the mathematical equation. “The new results are a milestone for climate research and demonstrate that when using powerful computers and physical models understanding nature is easier,” said Lars Kaleschke, the sea-ice specialist and co-author at the University of Hamburg.
To validate the accuracy of the simulation, the researchers compare their simulation data for the Beaufort Sea, the Kara Sea, the Laptev Sea and the Fram Strait with real sea-ice satellite data from the regions: “Our improved sea-ice model lead predictions coincide quite well with the satellite measurements. Apart from that, the results of the computer model confirm the underlying physical theory for describing the relationship between the acting forces and the deformation of the sea-ice,” said AWI expert Prof. Dr Thomas Jung.
As basis for their work, the scientists used a widely known theory, which describes the material qualities of the sea ice as an elastic-viscous-plastic medium. This was often criticised in recent years. But: “The new results show that the old theory for sea-ice physics still remains valid, if the calculation is performed with high accuracy,” said Lars Kaleschke.
Based on the new findings, the scientists can now start to develop more accurate simulations for the heat and mass flow in the arctic. The improved AWI sea-ice ocean model promises quite some application options for improved climate projections, weather forecasts and practical maritime issues.
Further information:
The study is freely available under the following title in the professional online journal Geophysical Research Letters:
Q. Wang, S. Danilov, T. Jung, L. Kaleschke, A. Wernecke: Sea ice leads in the Arctic Ocean: Model assessment, interannual variability and trends, DOI: 10.1002/2016GL068696
The video shows Arctic sea ice from a FESOM 4.5 km resolution simulation carried out by researchers from Alfred Wegener Institute (AWI), Germany. Concentration is shown with color; thickness is shown with shading.
With the friendly support of the by AWI.
