Ocean salinity explains climate phenomena
2 May 2016, by CEN Universität Hamburg

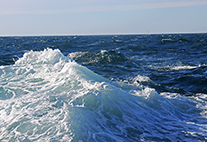
Photo: UHH/CEN/T. Wasilewski
Climate Science in "Hamburger Abendblatt": Even minor changes in the salinity of our oceans can have impacts on the climate. Yet this parameter has proven difficult to measure. Guest contribution by Julia Köhler.
News from Climate Science: Once a month, climate researchers report on their latest findings in the newspaper "Hamburger Abendblatt". Julia Köhler uses satellite data to identify changes in ocean salinity around the globe.
The only way to effectively monitor the entire planet is to view it from space. Accordingly, satellites are a vital source of key data for the research community. As an oceanographer, data on the salinity of our oceans is particularly interesting to me, because salinity, together with temperature, determines the density of seawater, which in turn can shape changes in global ocean currents. Further, salinity varies from place to place, and can tell us things like in which regions water is evaporating, and in which ones it is coming down as rainfall. Global data also allows us to observe how the water cycle above the ocean changes, for example in response to global warming.
We’ve only been able to derive salinity from satellite readings since 2010. Satellites measure the natural electromagnetic radiation produced by every physical body. The ocean’s radiation is also dependent on its salinity, a relation that becomes especially apparent from electromagnetic radiation in the microwave range. In this way, we can use the satellite readings to calculate the salinity, and to arrive at an overall view of salinity distributions across the ocean’s surface. The greatest advantage the satellites offer is their ability to scan the entire surface of the globe in only three days.
Tracking sources of error
This measuring method is still quite new, and still has to be validated and refined. That’s why my dissertation at the Center for Earth System Research and Sustainability focuses on exploring to what extent the satellite data corresponds to recordings from buoys and research ships, and on identifying potential sources of error. To find those sources, I took a closer look at one colder ocean region, and one warmer region: the European North Sea, and the Indian Ocean. I chose these candidates because the water’s surface temperature affects the precision of the data – the colder it is, the harder it is to measure the salinity, which also explains the errors often to be found in data from the polar regions. This has been confirmed by my research: when it comes to the salinity fields of the Indian Ocean, we can make a number of exciting observations – including fast-moving climate phenomena like the Madden-Julian oscillation, which traverses the entire planet in just 30 to 90 days. In contrast, in the European North Sea we can only identify seasonal cycles, like the melting of sea ice in the summer and its regrowth in the winter.
In addition to low temperatures, rough seas can also skew measurements. Further, the data from a relatively large area along continental coastlines is unfortunately useless, because the radiation from the land distorts the values from the ocean. Last but not least, human beings can distort the link between the ocean surface and satellites, like when ships illegally broadcast on frequencies reserved for researchers.
In the future, my colleagues and I will focus our efforts on the Indian Ocean, which remains one of the least-researched ocean regions. The salinity data can shed new light on the climate changes and extreme weather phenomena at work there, and the findings we gather could significantly improve systems for predicting rainfall levels or extreme phenomena like droughts in Eastern Africa.

Oceanographer Julia Köhler wrote this article and works at CEN. She is also one of four researchers who appear in the video and audio guides accompanying the exhibits on board the MS Wissenschaft, which is on tour through Germany and will be at anchor in Hamburg’s Hafencity port from May 13 to 16. Bild: UHH/CEN
More information:
