Visualize It! CEN displays visualizations at the Geomatikum
23 April 2018, by Lisa Wolf, CEN Universität Hamburg
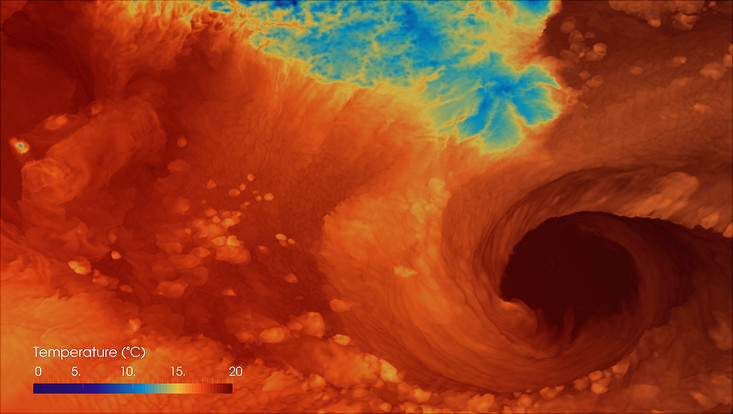
Photo: UHH/CEN/F. Brisc - Wiss. Kontakt: Guido Cioni, MPI-M
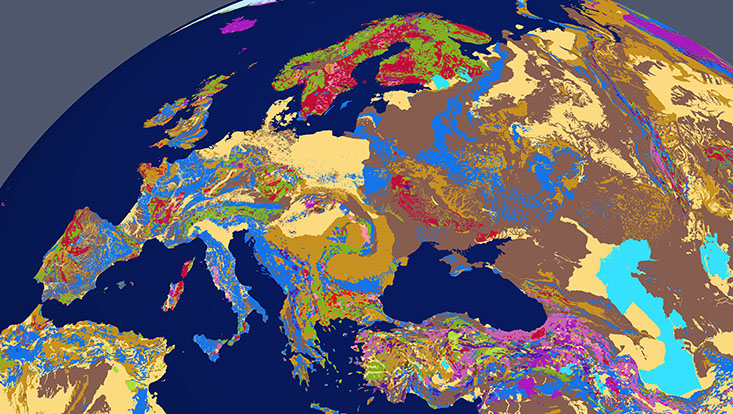
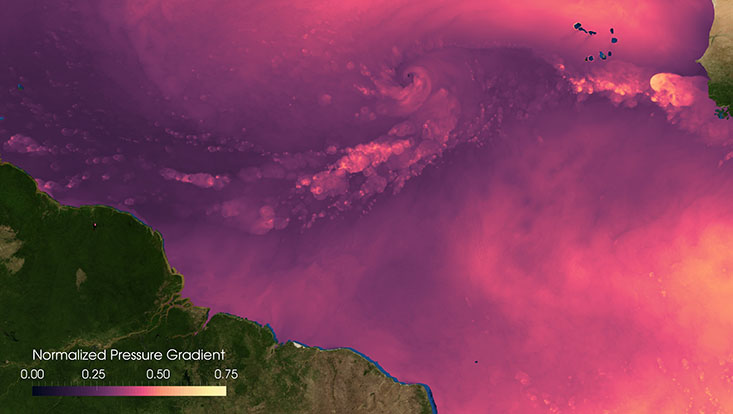
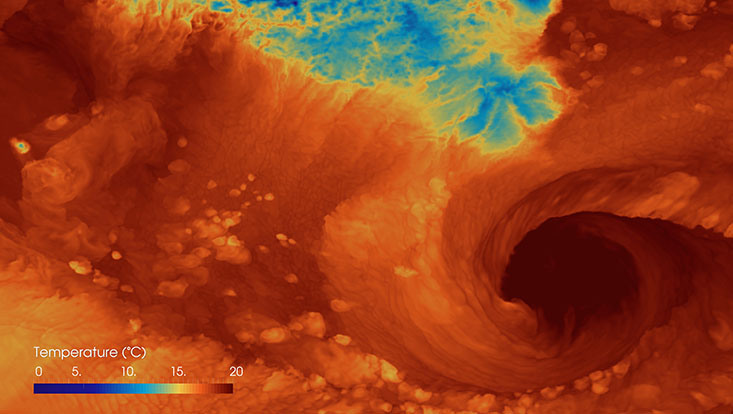
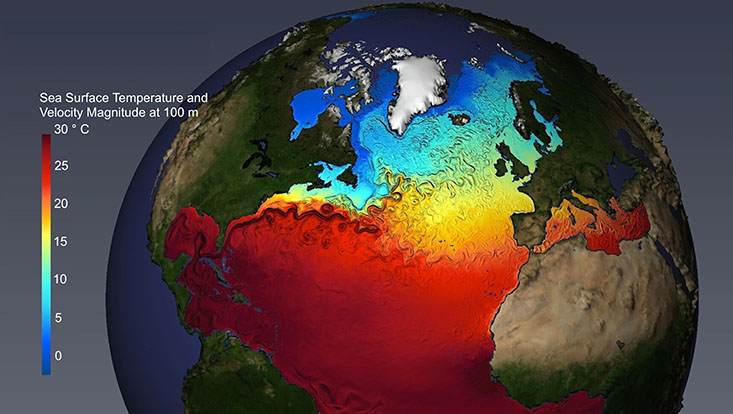
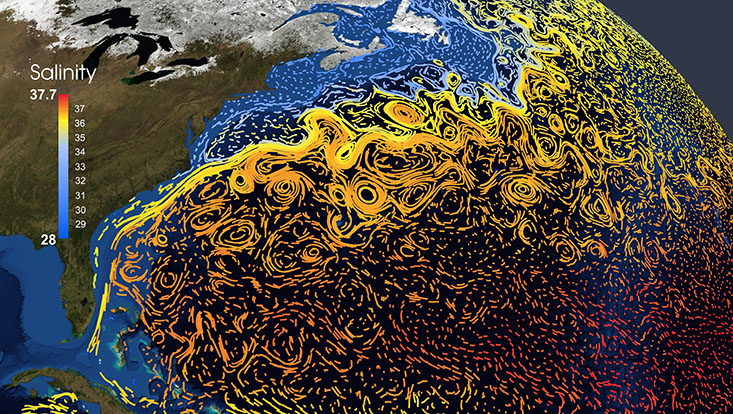
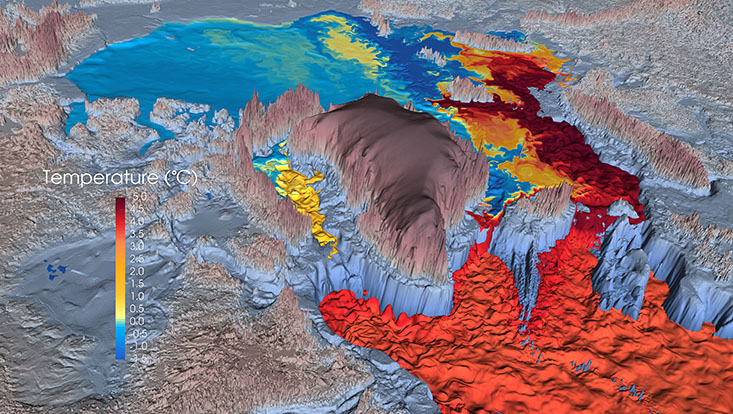
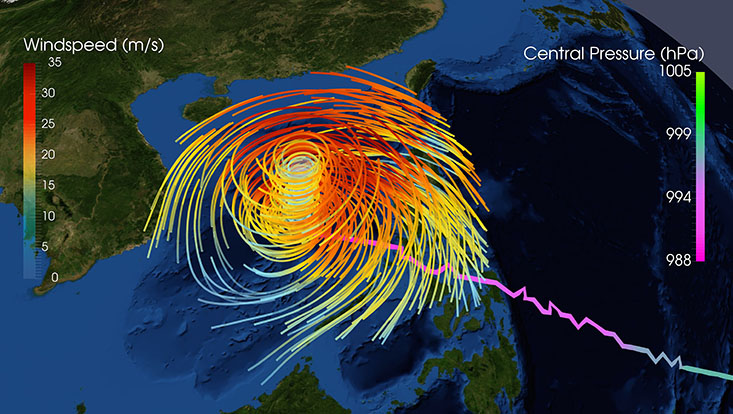
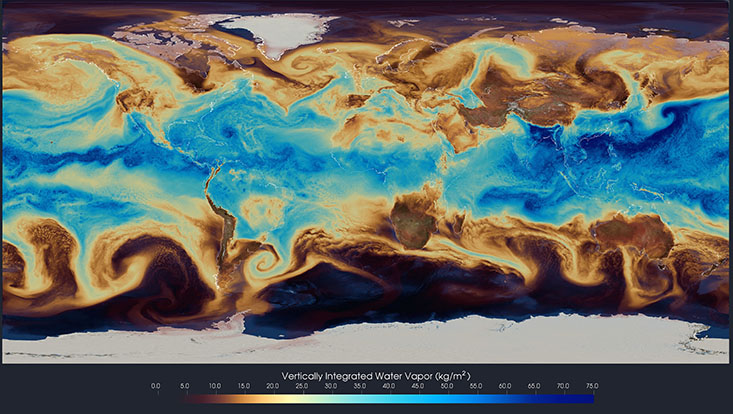
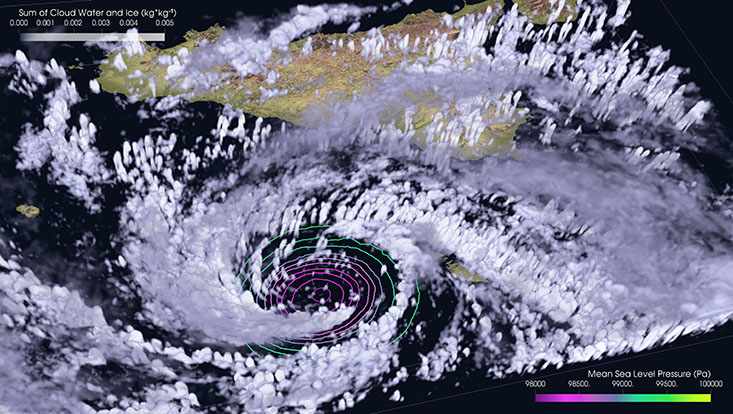
Visualizations are a powerful tool for illustrating the results of climate models – a fascinating sight, not just for scientists. From today, the CEN is exhibiting a selection of large format pictures in the foyer of the CEN Geomatikum. The exhibition will be on display until June 18th.
The exhibition shows the range of ways that various regions and topics – from hurricanes and ocean currents to rock types – can be visualized using different techniques. But vizualizations are much more than pretty pictures – they are a crucial part of climate research. Because investigating the climate involves creating a lot of data, and since there isn’t a “second Earth” that can be used for laboratory tests, researchers need simulations. With the help of super computers, they are able to glimpse into the future.
Correctly interpreting and efficiently evaluating the huge amount of data that this produces is extremely important – and at the same time extremely difficult. That’s why pictures or animations are often used to visualize simulations. This helps navigate the data jungle and provide new insights. Many of the visualizations in the exhibition are also available as videos – just scan the QR code next to the picture.
The visualizations on display are from the Cluster of Excellence CliSAP’s Climate Visualization Laboratory. The simulations were carried out by scientists from the following institutions:
- Center for Earth System Research and Sustainability (CEN)
- Climate Service Center Germany (GERICS)
- Hans Ertel Centre for Weather Research, Deutscher Wetterdienst (DWD)
- Helmholtz-Zentrum Geesthacht, Center for Materials and Coastal Research (HZG)
- Max Planck Institute for Meteorology (MPI-M)
If you have any suggestions or comments, please send us a mail(lisa.wolf"AT"uni-hamburg.de).
We look forward to your visit!

